

If you are talking to me,
I was just making fun of the quote:
Indicators show the past. Price Action "Indicates" the future.... and my bank account shows the present...
Ok, I'll keep my day job and forget the standup.
TygerKrane's Sema-Seminar
Moderator: moderators
Please add www.kreslik.com to your ad blocker white list.
Thank you for your support.
Thank you for your support.
-
TygerKrane

- rank: 1000+ posts

- Posts: 1733
- Joined: Mon Jan 25, 2010 3:36 pm
- Reputation: 297
- Location: Long Island, NY
- Gender:

Thanks for all the Sema help guys
Thanks for all the Sema help guys.
I can now look at the charts and know for certain what the hindsight chart might look like. (if that makes any sense?)
Should be interesting for analysis, not saying HOW MUCH it will change things, but it is an interesting bit of knowledge to understand...
But I'm still only going Long AJ and going Short EJ, as per [highlight=BLACK]Krane cat[/highlight][highlight=orange]ches Tyger[/highlight].
**Krane catches Tyger** !>I'm here to chew bubble gum and make major pips...and I'm all out of bubble gum.<!

TK,
I was curious if you could help me out on the TRO2010_DASHBOARD_3LZZ_DW. I can't seem to get it to respond, no signals. I have the 3_Level_ZZ_Semafor_TRO_MODIFIED_VERSION loaded in the upper chart and the dashboard in the lower window. Do you know what's going on? Thanks,
I was curious if you could help me out on the TRO2010_DASHBOARD_3LZZ_DW. I can't seem to get it to respond, no signals. I have the 3_Level_ZZ_Semafor_TRO_MODIFIED_VERSION loaded in the upper chart and the dashboard in the lower window. Do you know what's going on? Thanks,
"The simplicity of the markets is it's greatest disguise"
T
T
-
TygerKrane
- rank: 1000+ posts
- Posts: 1733
- Joined: Mon Jan 25, 2010 3:36 pm
- Reputation: 297
- Location: Long Island, NY
- Gender:
No can do...
Sorry tman,
I can't help on that one, I only use the 3_Level_ZZ_Semafor_TRO_MODIFIED_VERSION.
~Krane
I can't help on that one, I only use the 3_Level_ZZ_Semafor_TRO_MODIFIED_VERSION.
~Krane
**Krane catches Tyger** !>I'm here to chew bubble gum and make major pips...and I'm all out of bubble gum.<!
Please add www.kreslik.com to your ad blocker white list.
Thank you for your support.
Thank you for your support.
-
Shinobi-X

- rank: 50+ posts

- Posts: 95
- Joined: Mon May 18, 2009 2:38 am
- Reputation: 5
- Location: SOHO
- Gender:
Shinobi-X' Shin Kaizen
the sema without the sema and a few other things...
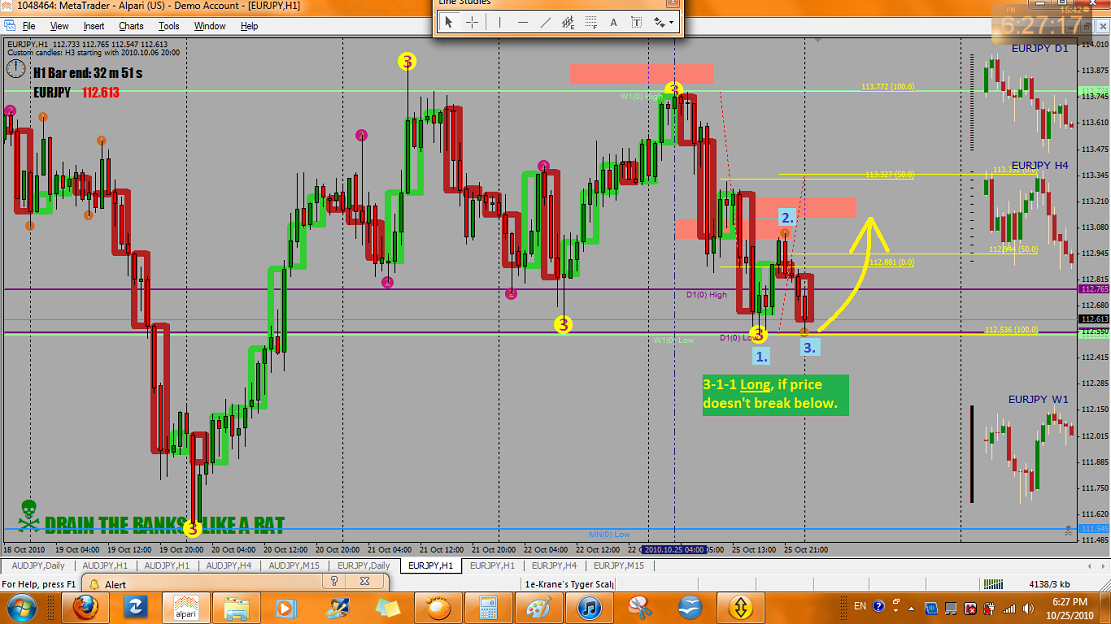
sema is the extreme of HL or simply the highest high and the lowest low during a particular period and 3rd sema is the ultimate extreme during that period. Where do you think the semas appeared on the chart in figure #1?
[align=center]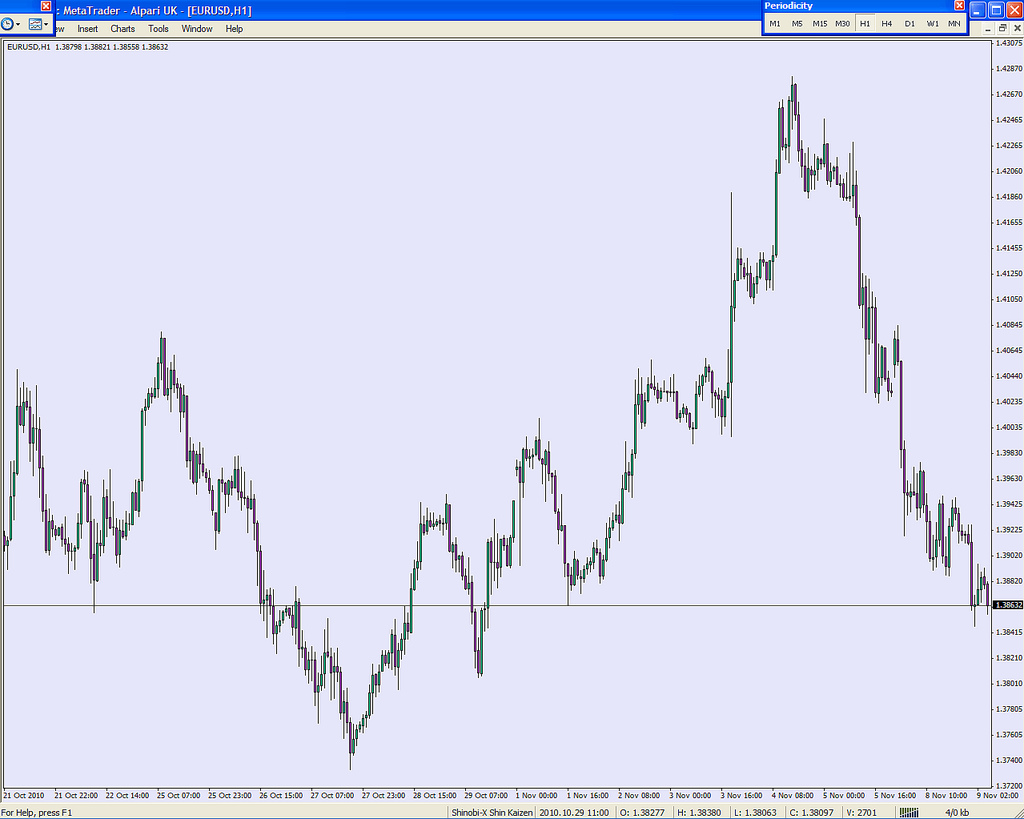
figure 1 by Shinobi-X, on Flickr[/align]
Only by considering the whole picture will you get the understanding of where the potential semas (or 3rd sema) might form.
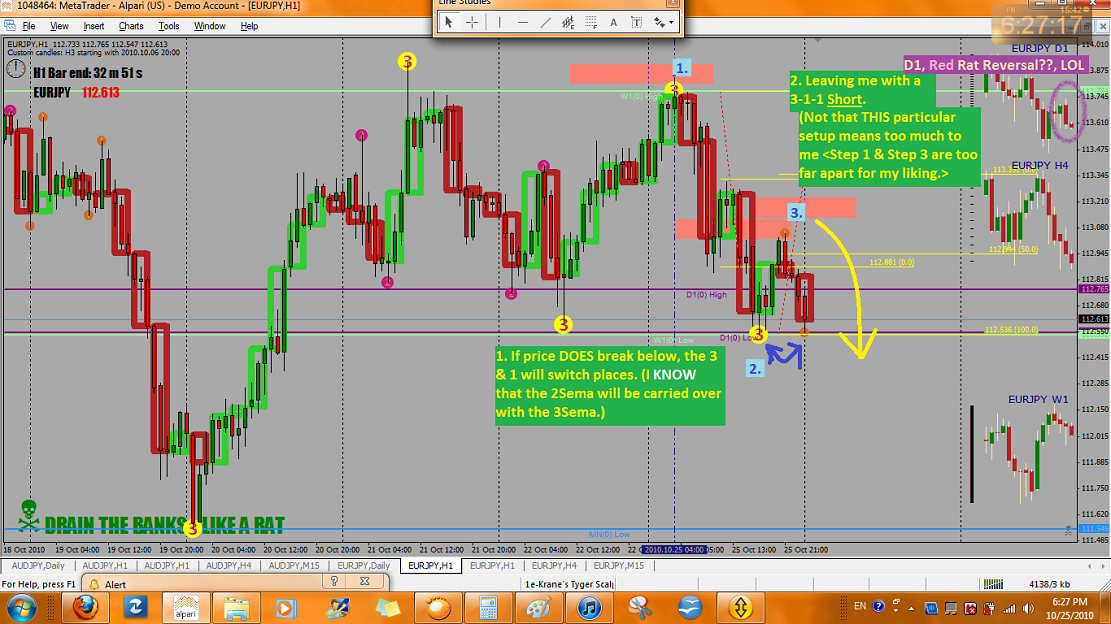
[align=center]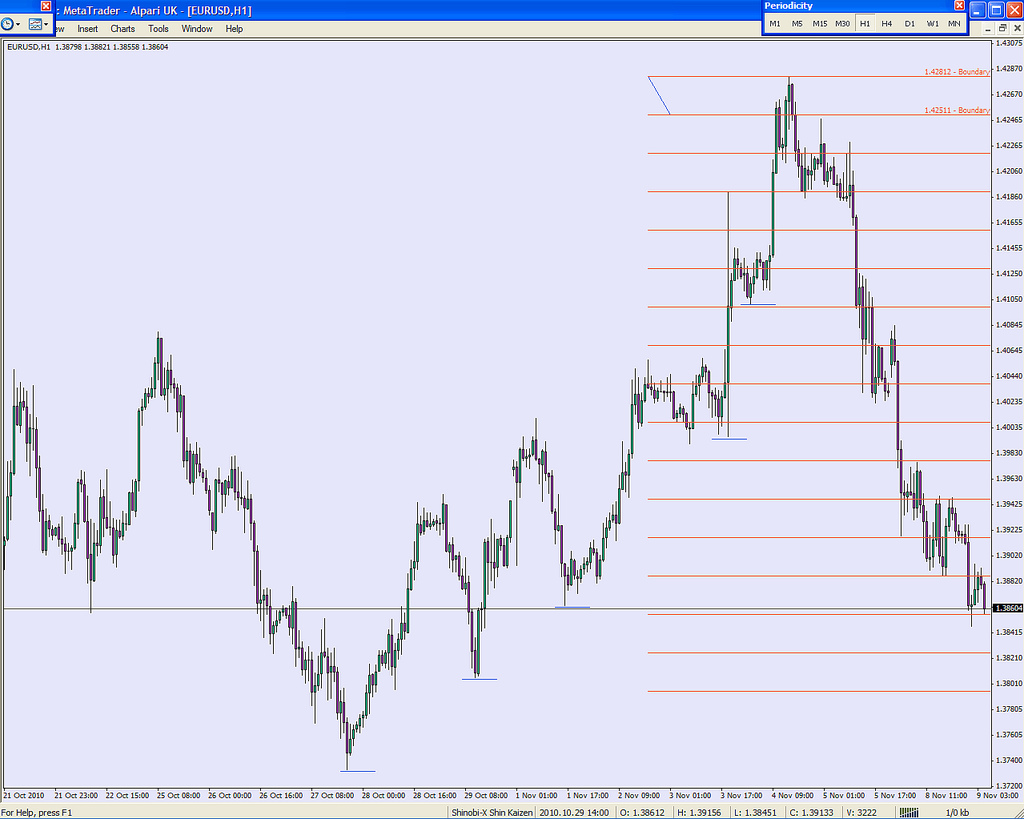
figure 2 by Shinobi-X, on Flickr[/align]
[align=center]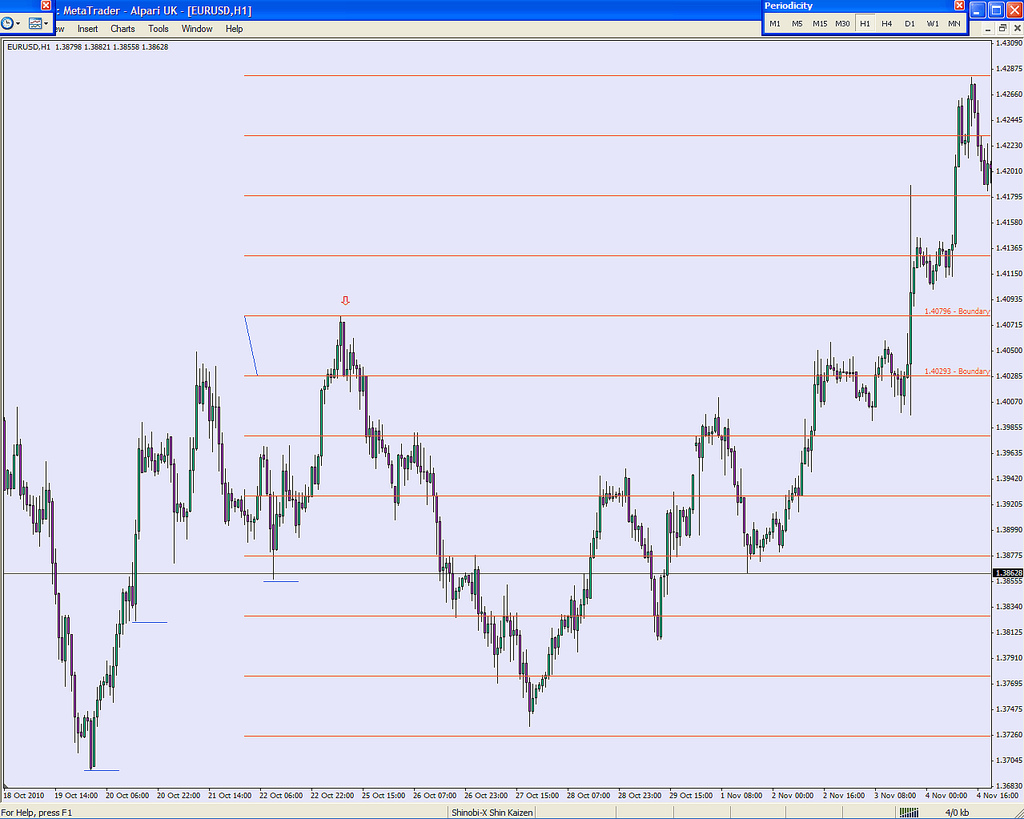
figure 3 by Shinobi-X, on Flickr[/align]
Entry: always enter near the ultimate extreme. Notice how far the uptrend moved (in figure #2)? Candlestick patterns are valid only after an apparent move (candlestick 101). And then, see how the Tsutsumi form...you can enter at the open of the next candle or somewhere inside the boundary. If the extreme (H or L) is not found on one of the candlesticks that formed the pattern you should be cautious.
Exit: semas are great for exits. If you see there are 3 potential exits you should divide your full entry into 3 equal parts (for full exploitation). You can close them partially if you want at the semas or cautiously carry all of them to the next stop and so on. If you noticed, each tomato line represents 1:1 RR. So, in figure #2, if you carry the position until now you will have 13 x the risk.
That is the full material and as always, the rest is observation and simple statistics.
Currently, I am also watching EURUSD and AUDUSD because things are also good in those two pairs.
reason for edit: for some reason, i can't see the pics/attachment when i logged out.
i don't see the images that i uploaded.
last resort... flickr. it's a pain in the ass..
the sema without the sema and a few other things...
sema is the extreme of HL or simply the highest high and the lowest low during a particular period and 3rd sema is the ultimate extreme during that period. Where do you think the semas appeared on the chart in figure #1?
[align=center]
figure 1 by Shinobi-X, on Flickr[/align]
Only by considering the whole picture will you get the understanding of where the potential semas (or 3rd sema) might form.
[align=center]
figure 2 by Shinobi-X, on Flickr[/align]
[align=center]
figure 3 by Shinobi-X, on Flickr[/align]
Entry: always enter near the ultimate extreme. Notice how far the uptrend moved (in figure #2)? Candlestick patterns are valid only after an apparent move (candlestick 101). And then, see how the Tsutsumi form...you can enter at the open of the next candle or somewhere inside the boundary. If the extreme (H or L) is not found on one of the candlesticks that formed the pattern you should be cautious.
Exit: semas are great for exits. If you see there are 3 potential exits you should divide your full entry into 3 equal parts (for full exploitation). You can close them partially if you want at the semas or cautiously carry all of them to the next stop and so on. If you noticed, each tomato line represents 1:1 RR. So, in figure #2, if you carry the position until now you will have 13 x the risk.
That is the full material and as always, the rest is observation and simple statistics.
Currently, I am also watching EURUSD and AUDUSD because things are also good in those two pairs.
reason for edit: for some reason, i can't see the pics/attachment when i logged out.
i don't see the images that i uploaded.
last resort... flickr. it's a pain in the ass..
- Attachments
-
 shinobi-x shin kaizen.tpl
- eye-friendly colors template
- (2.56 KiB) Downloaded 390 times
Last edited by Shinobi-X on Tue Nov 09, 2010 9:31 am, edited 2 times in total.
The gap between reality and dream is called action.
-
Shinobi-X
- rank: 50+ posts
- Posts: 95
- Joined: Mon May 18, 2009 2:38 am
- Reputation: 5
- Location: SOHO
- Gender:
i almost forgot... as you can see, i no longer use zz indicator because all you really need to do is to train your eyes.
sometimes wearing a ninja mask can help speed the learning process because you will cover everything else and only your eyes will be revealed and used. you can choose wearing a mask...
[align=center]
ninja mask by Shinobi-X, on Flickr[/align]
or wearing the modern version of shinobi shozoku (full ninja suit)
[align=center]

full suit by Shinobi-X, on Flickr[/align]
LOL...
sometimes wearing a ninja mask can help speed the learning process because you will cover everything else and only your eyes will be revealed and used. you can choose wearing a mask...
[align=center]
ninja mask by Shinobi-X, on Flickr[/align]
or wearing the modern version of shinobi shozoku (full ninja suit)
[align=center]
full suit by Shinobi-X, on Flickr[/align]
LOL...
The gap between reality and dream is called action.
-
forexbob

- rank: 150+ posts

- Posts: 275
- Joined: Mon Apr 20, 2009 9:52 am
- Reputation: 31
- Location: Planet Earth
- Gender:

dchappy wrote:I have always viewed the semafor as an " area of exhaustion " and not a single point .
Using a " lagging " trigger , gives the semafor time to " settle - down " and confirm a reversal .
( Indicators give an "indication " of something that May or May not happen )
Just my 2 cents ..
think the same, and this semafor indi also reminds me of the method of 3clipz3.
http://kreslik.com/forums/viewtopic.php ... ht=3clipz3
he had on his 1 min chart the 4, 5 and 6 semafor.
he is a breakout trader.
i have been looking extensively during the last 2 years at PA on EURUSD, and
when price breaksout(sem6) it finally retraces after exhausting and i think more often then not it breaks out further.
just my thoughts , i do not trade his method
The highest Forex rebates: http://www.cashbackforex.info
-
Shinobi-X
- rank: 50+ posts
- Posts: 95
- Joined: Mon May 18, 2009 2:38 am
- Reputation: 5
- Location: SOHO
- Gender:
i don't really have a specific thread to post this so i decided to keep this one close to the last one.
the trade is simple, you observe the chart and try to identify the ultimate or the best place to enter a trade.
this is the very last trade that i took that generated a good risk reward ratio of 1:33.9 and my risk is 2%. it is basically an extended scalp trade (by scalp i mean any trade with SL lower than 10 and in this case my initial SL was 5). when price move in my favor i moved SL to BE making it risk free. the chart is self explanatory. first go to D1 and then drill it down to H1. the H1 bar is a typical engulfing candlestick and it was the 2nd best ultimate place during the last couple of weeks (the highest during the year). dragon33's and MO's posts regarding MOMO and Mighty Zone are worth reviewing. the rest is the understanding of wave and candlestick.
now to the point...
my D1 chart looked like this (I use Alpari UK)
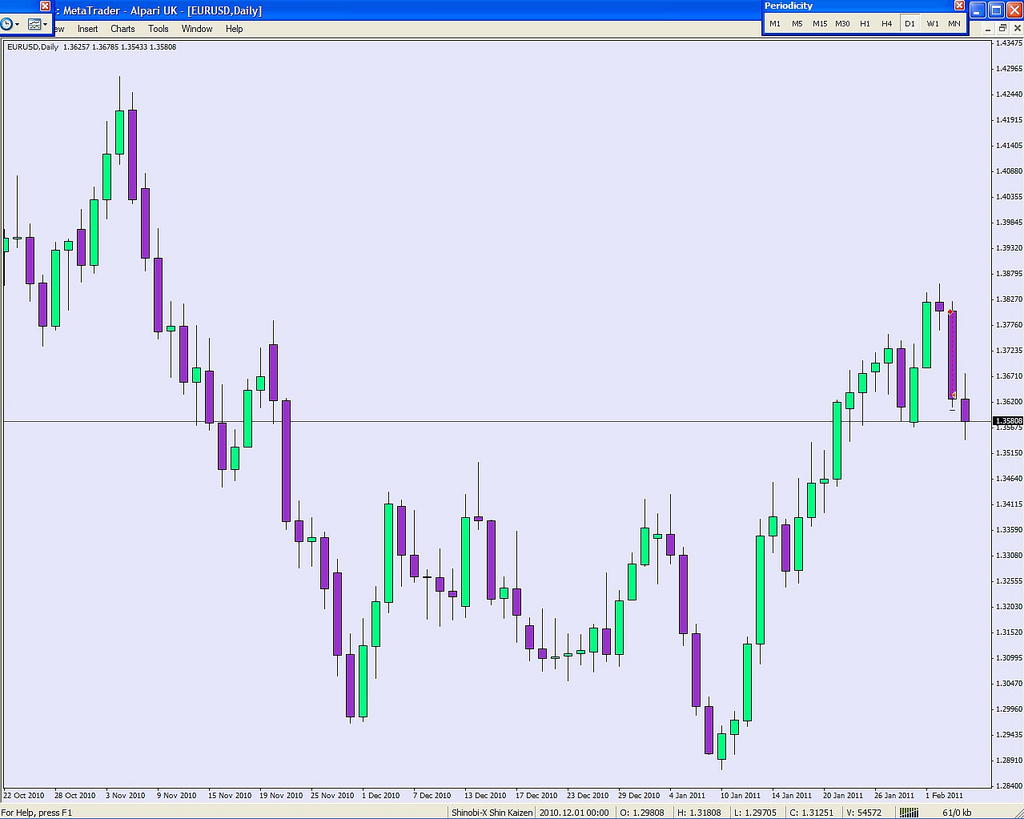
ScreenHunter_14 Feb. 05 13.11 by Shinobi-X, on Flickr
and the H1 chart looked like this...
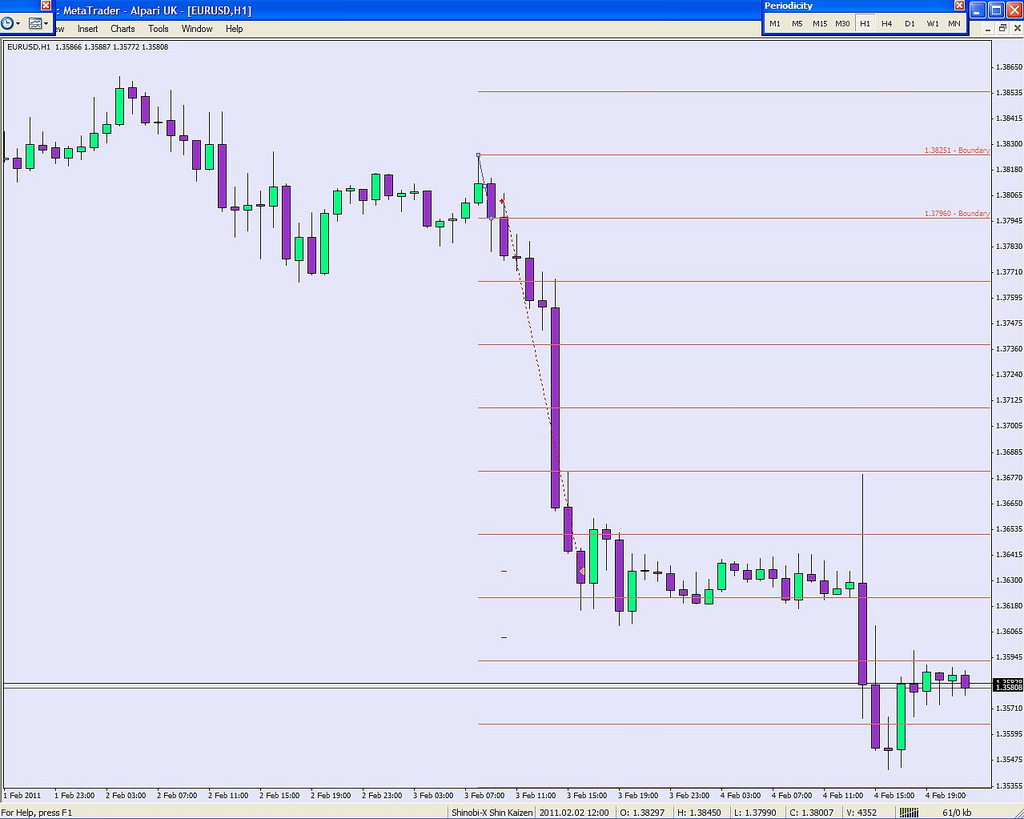
ScreenHunter_15 Feb. 05 13.12 by Shinobi-X, on Flickr
the short red line was my protective SL and the short black line was my initial TP.
notice that i entered inside the 2nd best ultimate extreme in H1 and the ultimate extreme in D1. entering after the close of the engulfing bar you required more than 30 pips worth of SL and by now you would already make about 8 times the risk (1:8 risk reward). i didn't want to sit through the next day so i put a protective SL. my initial target was 200 pips and i didn't get it.
i'm pretty sure that everything not mentioned here can be found in your own chart via lower TF (M15, M5 or even M1).
enjoy your weekend.
the trade is simple, you observe the chart and try to identify the ultimate or the best place to enter a trade.
this is the very last trade that i took that generated a good risk reward ratio of 1:33.9 and my risk is 2%. it is basically an extended scalp trade (by scalp i mean any trade with SL lower than 10 and in this case my initial SL was 5). when price move in my favor i moved SL to BE making it risk free. the chart is self explanatory. first go to D1 and then drill it down to H1. the H1 bar is a typical engulfing candlestick and it was the 2nd best ultimate place during the last couple of weeks (the highest during the year). dragon33's and MO's posts regarding MOMO and Mighty Zone are worth reviewing. the rest is the understanding of wave and candlestick.
now to the point...
my D1 chart looked like this (I use Alpari UK)
ScreenHunter_14 Feb. 05 13.11 by Shinobi-X, on Flickr
and the H1 chart looked like this...
ScreenHunter_15 Feb. 05 13.12 by Shinobi-X, on Flickr
the short red line was my protective SL and the short black line was my initial TP.
notice that i entered inside the 2nd best ultimate extreme in H1 and the ultimate extreme in D1. entering after the close of the engulfing bar you required more than 30 pips worth of SL and by now you would already make about 8 times the risk (1:8 risk reward). i didn't want to sit through the next day so i put a protective SL. my initial target was 200 pips and i didn't get it.
i'm pretty sure that everything not mentioned here can be found in your own chart via lower TF (M15, M5 or even M1).
enjoy your weekend.
The gap between reality and dream is called action.
-
Shinobi-X
- rank: 50+ posts
- Posts: 95
- Joined: Mon May 18, 2009 2:38 am
- Reputation: 5
- Location: SOHO
- Gender:
another failed attempt.
also another example of extended scalping (5 pips @ 2%). was also looking to grab 200 pips. price went past 120-ish pips but turned downward. moved SL to BE early on.
the target was 1:40 rr...
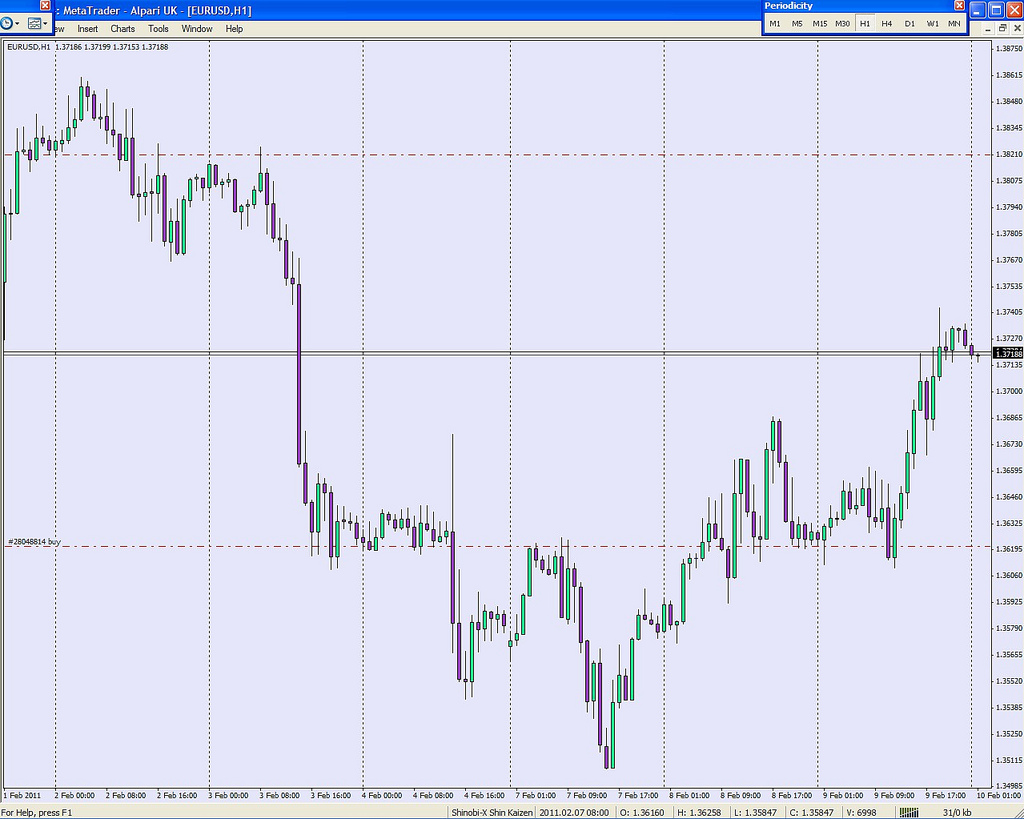
ScreenHunter_01 Feb. 10 00.08 by Shinobi-X, on Flickr
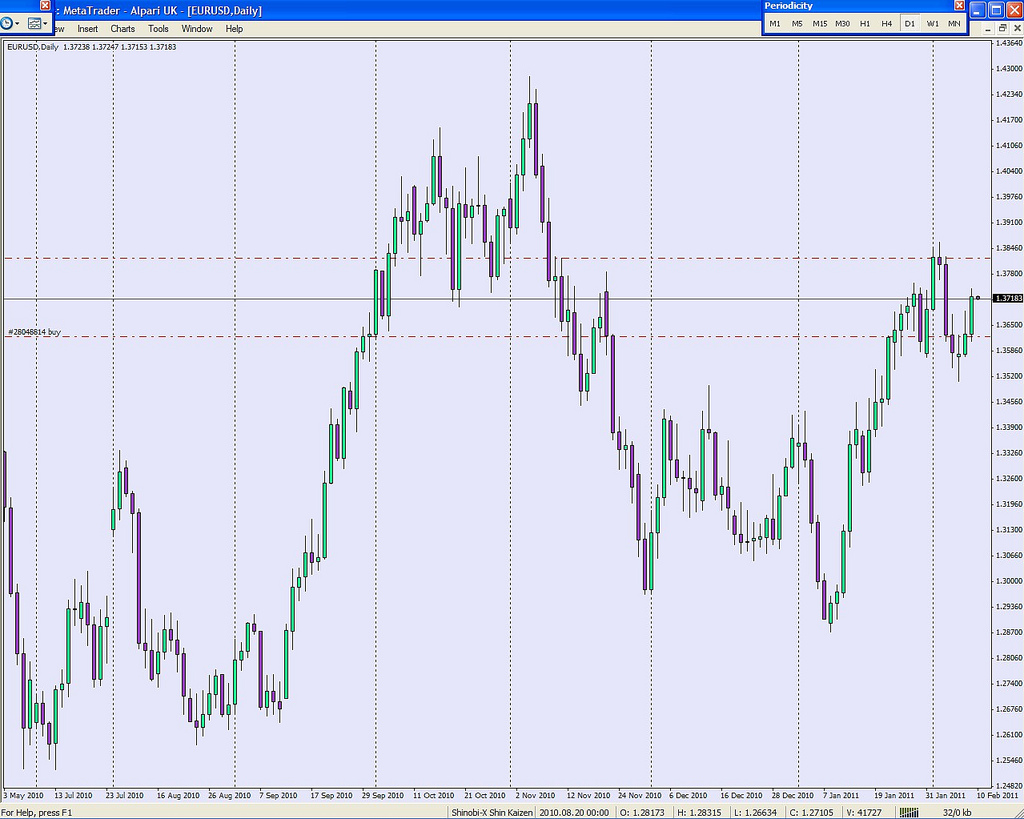
ScreenHunter_02 Feb. 10 00.08 by Shinobi-X, on Flickr
can't afford losing more than 30 pips or so so i close the position manually. another consideration was price is already in the middle of last high and the latest low.
the final result is 1:18.74 rr...
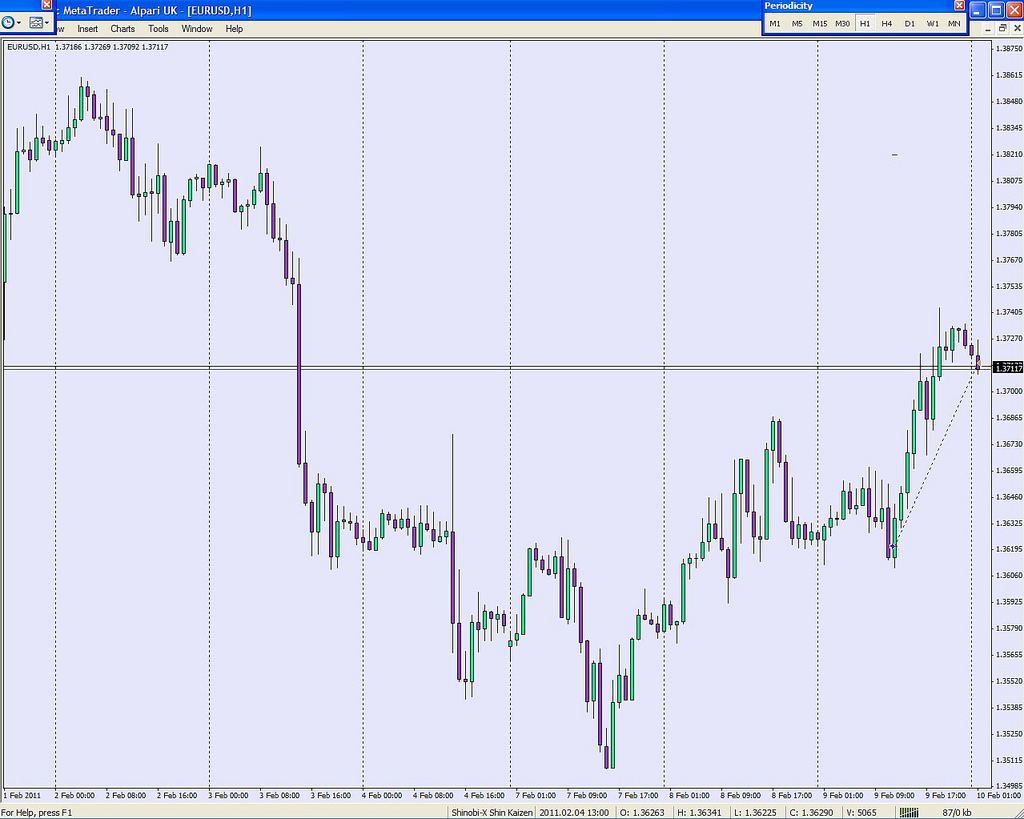
ScreenHunter_01 Feb. 10 00.54 by Shinobi-X, on Flickr
the original idea behind the last two trades (this one and last week) is to hold a scalp trade for as long as the move allow. by a move i mean not necessarily a trend on D1 it could also be a short trend H1. there's always a situation where exception steps in. MO has been pounding this concept of trade to infinity to kreslik members. so i hope many traders can also apply this concept with their own trading method.
rinse and repeat
have a great trading guys!
also another example of extended scalping (5 pips @ 2%). was also looking to grab 200 pips. price went past 120-ish pips but turned downward. moved SL to BE early on.
the target was 1:40 rr...
ScreenHunter_01 Feb. 10 00.08 by Shinobi-X, on Flickr
ScreenHunter_02 Feb. 10 00.08 by Shinobi-X, on Flickr
can't afford losing more than 30 pips or so so i close the position manually. another consideration was price is already in the middle of last high and the latest low.
the final result is 1:18.74 rr...
ScreenHunter_01 Feb. 10 00.54 by Shinobi-X, on Flickr
the original idea behind the last two trades (this one and last week) is to hold a scalp trade for as long as the move allow. by a move i mean not necessarily a trend on D1 it could also be a short trend H1. there's always a situation where exception steps in. MO has been pounding this concept of trade to infinity to kreslik members. so i hope many traders can also apply this concept with their own trading method.
rinse and repeat
have a great trading guys!
The gap between reality and dream is called action.
Please add www.kreslik.com to your ad blocker white list.
Thank you for your support.
Thank you for your support.