
So some hedges with the longs and expecting to take possible 2 positions off.
Also want to play attention to any big candles that play out next week.
The main signal the last week was the rising wedge pattern that was developing and pretty much matured enough to expect a breakdown from it, which is what is expected from it. You been hearing a lot more about falling wedges the rising wedges lately we just had a great falling wedge in IBM a few weeks ago and it was even perfect to the point of its measured move target
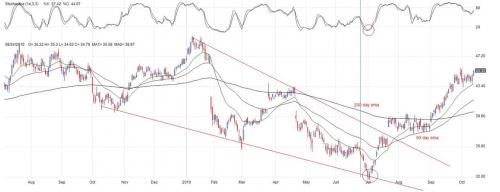
Chart Larger Image View
So rising wedges are not as common and in most cased falling wedges are continuation patterns in a greater uptrend. So this rising wedge is definitely not a pullback in a larger downtrend. This is where i would like to trade a rising wedge. Either way this looks like a good wedge and it does look like we have some more pullback coming.
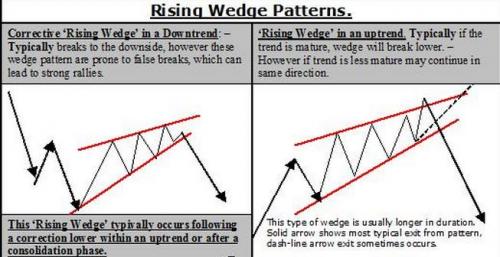
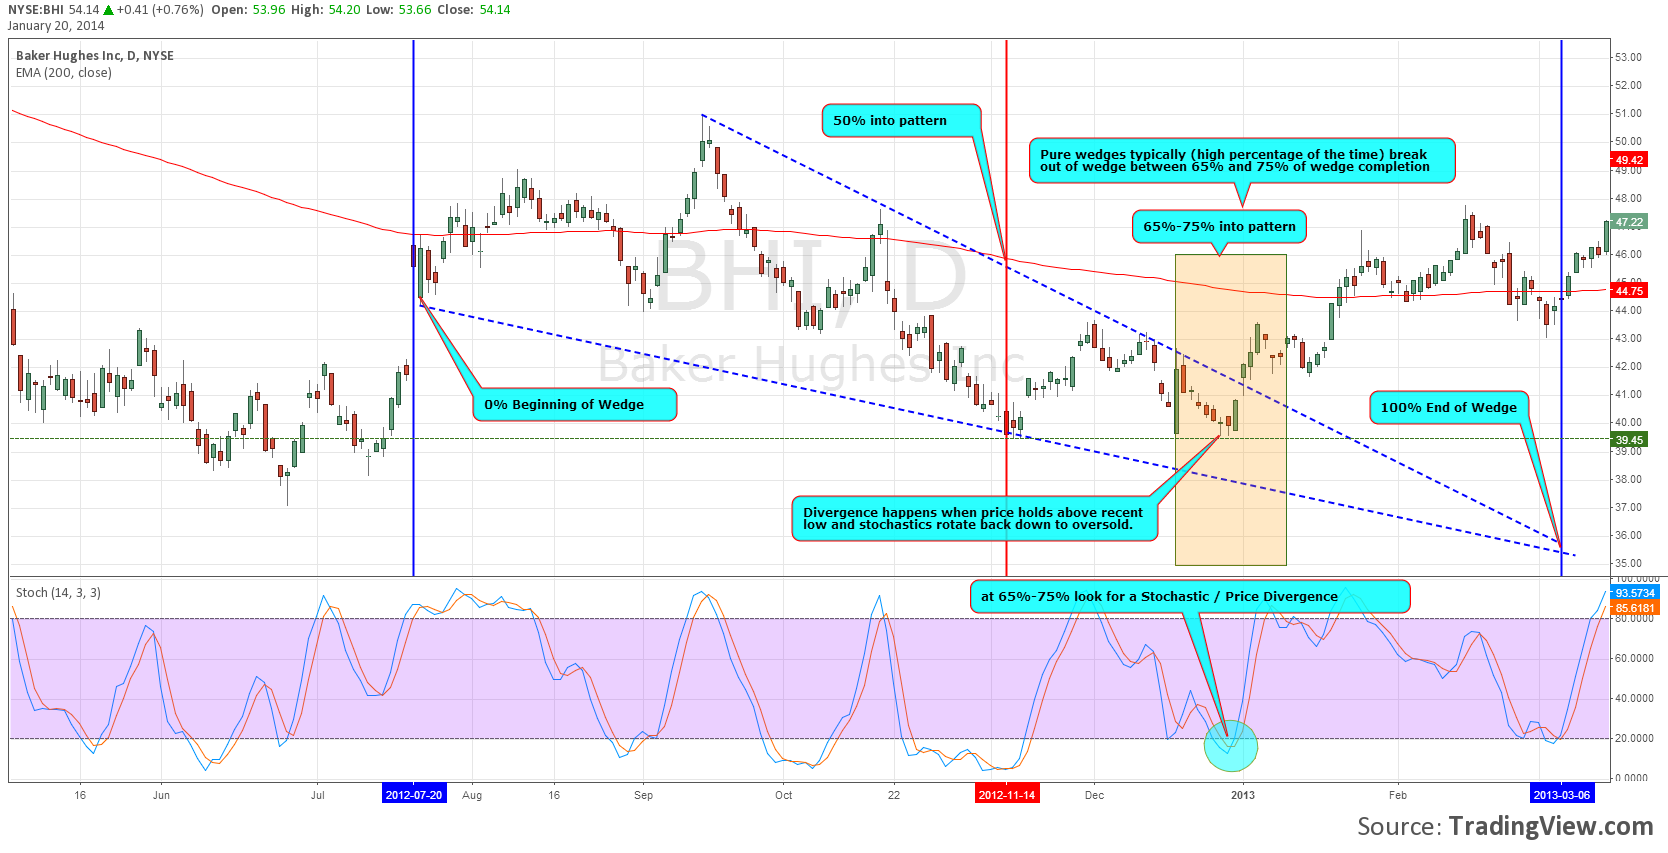
I just recently wrote up some notes on wedges and even though the examples are mostly with falling wedges you just have to reverse the rules for rising wedges. The wedge is one of my favorite patterns.
Wedge Patterns: You can have 3 different wedges. First is my favorite to trade the Falling Wedge which has a bullish bias to it. The rising Wedge is just the opposite and with a negative bias and finally the symmetrical triangle which has no directional slope and no bullish or bearish bias on its own merit.
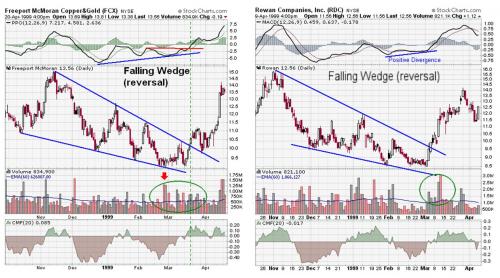
Lets start off with some great examples of what a proper wedge looks like. 2 Lines form this pattern and there is a few key points to look for. Not all falling wedges are equal and just like 1-2-3 Patterns over time you will get a feel for the angles of the 2 lines. In a falling wedge the upper downtrend line (resistance) and the lower (support) line are in a process to converge at a point in the distant future. This convergence should not happen and you want to see the lower support line at less of an angle to the top trend line The chart will play out with the stock making new lower lows but this penetration becomes shallower. Shallower lows indicate a decrease in selling pressure and create a lower support line with less negative slope than the upper resistance line.
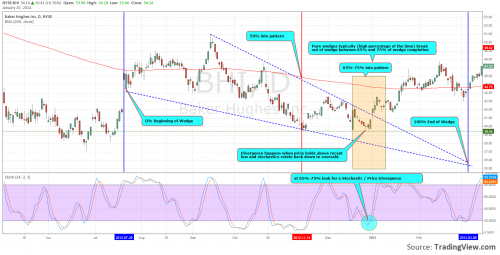
Chart Larger Image View


