Closing prices tell you everything you need to know: pattern: closes start stacking in a tight area.
breakout: closes leave the pattern.
This chart uses the trend of the 'relatively good advisor': ta.sma(ta.rma(hlc3,3),3):
If you're trading long and you get a red brick with no follow through, no lower close, then the move is still bullish.
I use different chart styles depending on my mood

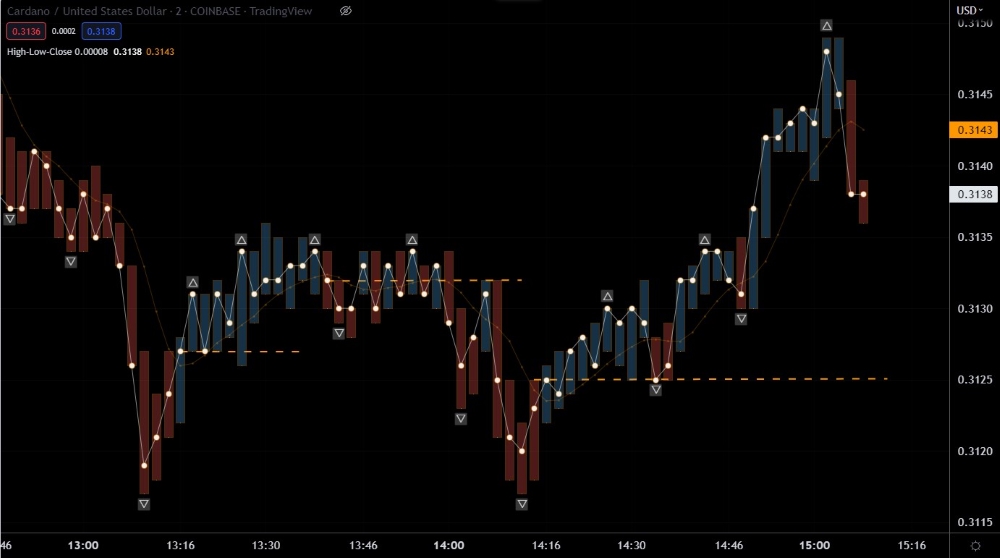
- CL_FTW.jpg (146.02 KiB) Viewed 1668 times
Code: Select all
//@version=5
indicator(title = "BSW", shorttitle = "High-Low-Close", overlay = true)
//-----Chart-Setup-----//
adj = input(0.0000, "movePointy")
plo1 = input(true, title = "03_SRMA?", inline = "2")
plo2 = input(false, title = "20_SMA?", inline = "2")
trend = ta.sma(ta.rma(hlc3,3),3) < close ? color.rgb(72, 161, 233) : color.red
h = high
l = low
c = high
o = low
updnCon = h[1] < c ? "up" : l[1] > c ? "dn" : "no"
updnCon := updnCon == "no" and o < c ? "white" : updnCon == "no" and o > c ? "black" : updnCon
transp = (close[4] + close[3]) / 2 < close ? 70 : 70
palette = updnCon == "up" ? color.rgb(89, 150, 199) : updnCon == "dn" ? color.red : updnCon == "white" ? color.white :  updnCon == "black" ? color.black  : color.fuchsia
plotcandle(o,h,l,c, color = color.new(trend,transp), wickcolor =color.rgb(107, 113, 133), bordercolor = color.new(color.orange,70), display = display.all - display.status_line - display.price_scale)
plot(close, color = color.new(#e1e6eb, 40), style = plot.style_line, linewidth = 1, join = true, display = display.all - display.status_line)
plot(close, color = color.new(color.orange, 45), style = plot.style_circles, linewidth = 4, join = false, display = display.all - display.price_scale - display.status_line)
plot(close, color = color.new(color.white, 10), style = plot.style_circles, linewidth = 3, join = false,display = display.all - display.price_scale)
//-----Better-MA-----//
ma1 = (ta.sma(hlc3, 16) + ta.sma(hlc3, 19)[3]) / 2
sig = ta.lowest(ma1, 2) < ma1 ? color.new(color.rgb(89, 150, 199),0) : ta.highest(ma1,2) > ma1 ? color.new(color.red,0) : color.new(color.gray,0)
plot(plo2 ? ma1 : na, color = color.new(sig,76), style = plot.style_line, linewidth = 2, display = display.all - display.status_line - display.price_scale)

fh = h
fl = l
cond1 = close[2] > close[3] and close[2] > close[4] and close[2] > close[5] and close[2] > close[6] and close[2] >= close[1] and close[2] >= close[0] // is highest of 5, is >= 2 to the right.
cond2 = close[2] < close[3] and close[2] < close[4] and close[2] < close[5] and close[2] < close[6] and close[2] <= close[1] and close[2] <= close[0] // is lowest of 5, is <= 2 to the right.
plotchar(cond1 ? fh[2] + adj : na, char = "⬜", color = color.new(color.orange,78), offset = -2, location = location.absolute, editable = false, display = display.all - display.status_line)
plotchar(cond2 ? fl[2] - adj : na, char = "⬜", color = color.new(color.orange,78), offset = -2, location = location.absolute, editable = false, display = display.all - display.status_line)
plotchar(cond1 ? fh[2] + adj : na, char = "△", color = color.new(color.white,25), offset = -2, location = location.absolute, editable = false, display = display.all - display.status_line)
plotchar(cond2 ? fl[2] - adj : na, char = "▽", color = color.new(color.white,25), offset = -2, location = location.absolute, editable = false, display = display.all - display.status_line)

plot(plo1 ? ta.sma(ta.rma(hlc3,3),3) : na, color = color.new(color.orange,76), style = plot.style_circles, join = true )


