Takin it while its givin it.
Letting the last postion trail out or close at 97.05
Back at NY session
A fresh start! Doji's Trading Journal
Moderator: moderators
Please add www.kreslik.com to your ad blocker white list.
Thank you for your support.
Thank you for your support.


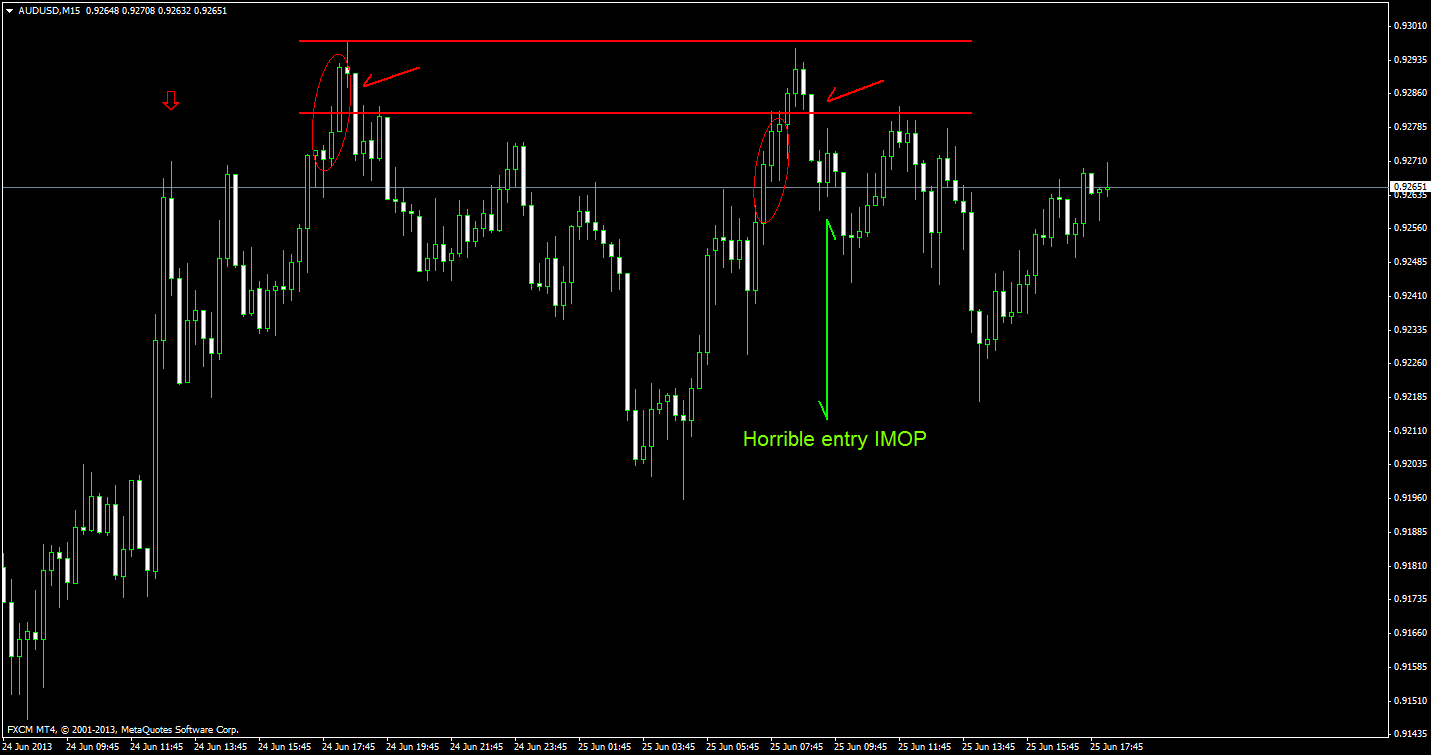
Dan wrote:Loser today, any comments guys? I still think direction is right, just too soon.
You had two things working against you:
1) a series of three candles with shrinking body sizes pointing to S/D above your position.
2) buying into a longer red candle.
When you go long, you should do so because price is closing higher than something.
If you buy on a retrace then you should do so because a higher period chart has closed over something.
Bodies should be facing the direction of profit & wicks should face the direction of loss...
& size matters =)
-
dojirock

- rank: 1000+ posts

- Posts: 1921
- Joined: Tue Nov 17, 2009 10:11 pm
- Reputation: 726
- Gender:

- Contact:
Dan, analysis for U/J, AUD/USD same but reversed...see pics
Good analysis. I assuming your basing it on the hourly time frame,
Broken 50 and 100 line. Thats correct so far. Be a little more conservative on the trigger when basing a trade on a hourly analysis. I use the color change . See how it appears to fail by moving back down, leaving a green, red candle? Entry would be as price moved back up and crosses the line for a long. If price moves back up but doesnt close above the line then take a short when the price closes back below the newly formed red,green candle.
your right I hope in just being to early. I am short on u/j and long on a/u banking alot on it right now. My reason is look left at the 4hr down momentum candle and fib it out with a 50 percent. All the 4 hour candles are failing to close above that 50 line(97.82). Could be a big short trade due to its a 4hr fail, in the next asian or london session. Just the opposite for a/u (98.50)
Be ready...
doji
- Attachments
-
- kr1.png (61.19 KiB) Viewed 3135 times
It always takes Momentum to break Momentum!
"A small loss is just as satisfying as a large gain" -MO
"Sometimes we need to stop learning and start thinking...."
"Once you stack, you'll never go back!"
"A small loss is just as satisfying as a large gain" -MO
"Sometimes we need to stop learning and start thinking...."
"Once you stack, you'll never go back!"
Please add www.kreslik.com to your ad blocker white list.
Thank you for your support.
Thank you for your support.
-
ahmedalhoseny
- rank: 50+ posts

- Posts: 111
- Joined: Sat Dec 31, 2011 7:28 pm
- Reputation: 0
- Gender:

- Contact:
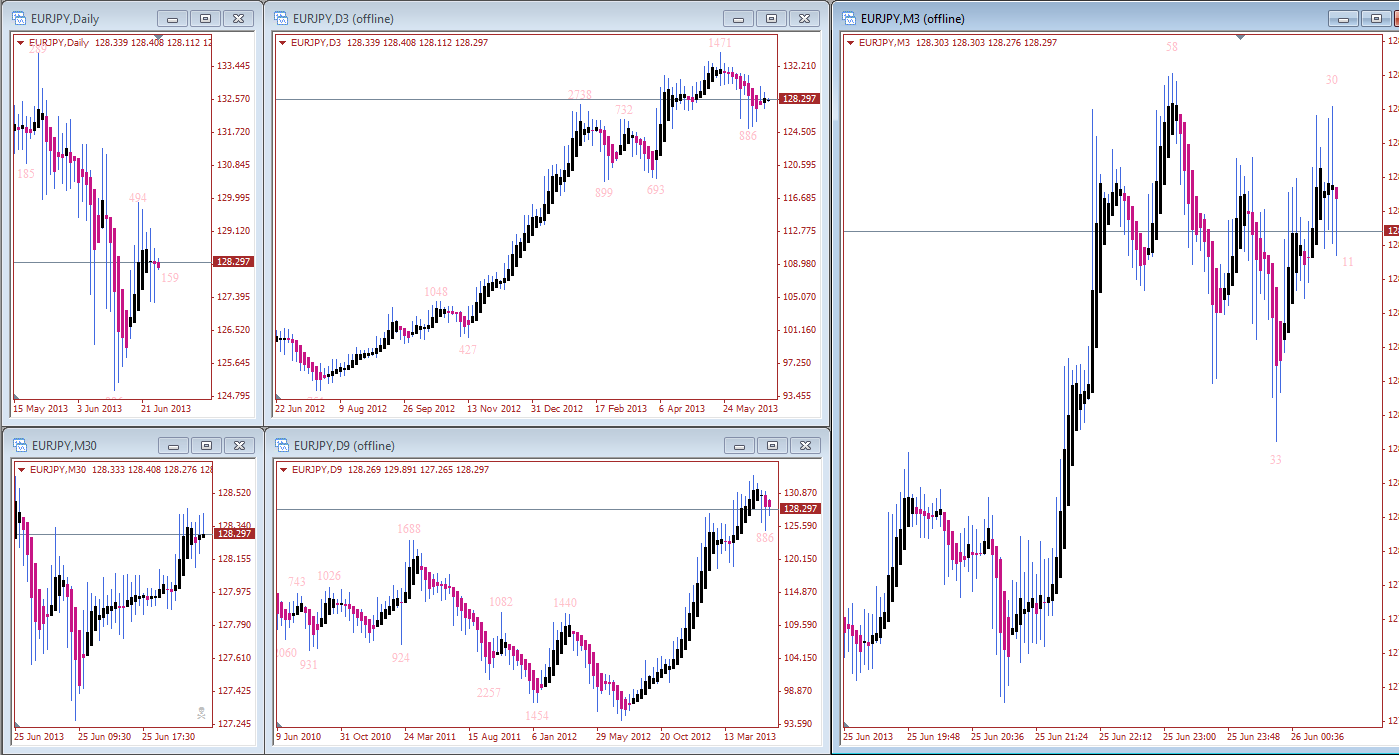
Another example:
If you look at the M3 chart, you can clearly see that we are in an area of profit taking.
If I wanted to go long then I would take a look at D1, D3, D9, & pick one that looks the most promising.
I would then refer to M30 (over "something"?, generally closing higher?) and then look to M3 for an entry (over "something"?, generally closing higher?)
Trading is so easy:
Your stops are placed on large charts: D1, D3, D9, etc
You have multiple lot sizes of various "risk space" that determines if you can afford the position on large charts.
If the chart looks good and you can afford the stop then hit the entry button; you have plenty of time to be greedy, there is no need to max out right away.
As the large chart continues to move in the direction of profit then you increase your lot size.
I highly advise against trading nothing but small charts as it is a very rare individual who finds long term success doing this.
If you risk 4.5% per trade then you should risk 1.5% on small charts and set aside the remaining 3% for the long term direction.
There is so much to say, but nothing that hasn't already been said.
Please add www.kreslik.com to your ad blocker white list.
Thank you for your support.
Thank you for your support.