

Nice graphic Pebble. May I ask what setup you are using for creating the graphics and which data source (live?). I have a couple of ideas (stats) that I want to make visual graphics from. I prefer not to do it in mt4.
Cheers,
Withnail
Forex pairs spread & volume statistics
Moderator: moderators
Please add www.kreslik.com to your ad blocker white list.
Thank you for your support.
Thank you for your support.
-
PebbleTrader

- rank: 1000+ posts

- Posts: 1633
- Joined: Fri Nov 12, 2010 2:15 am
- Reputation: 15
- Gender:

-
PebbleTrader
- rank: 1000+ posts
- Posts: 1633
- Joined: Fri Nov 12, 2010 2:15 am
- Reputation: 15
- Gender:
Thanks Pebble, I was inspired by your previous thread and some of the tools in Oanda lab. Nice to play around with in between trades. I like to program stuff so its bit if a geeky thing rather that looking for an edge. There are some nice courses about stats and programming at coursea.org for anybody interested. I am learning R from there.
1. Big loss, 2. Small Loss, 3. Big Win, 4. Small Win --- just prevent 1.

Please add www.kreslik.com to your ad blocker white list.
Thank you for your support.
Thank you for your support.
-
PebbleTrader
- rank: 1000+ posts
- Posts: 1633
- Joined: Fri Nov 12, 2010 2:15 am
- Reputation: 15
- Gender:
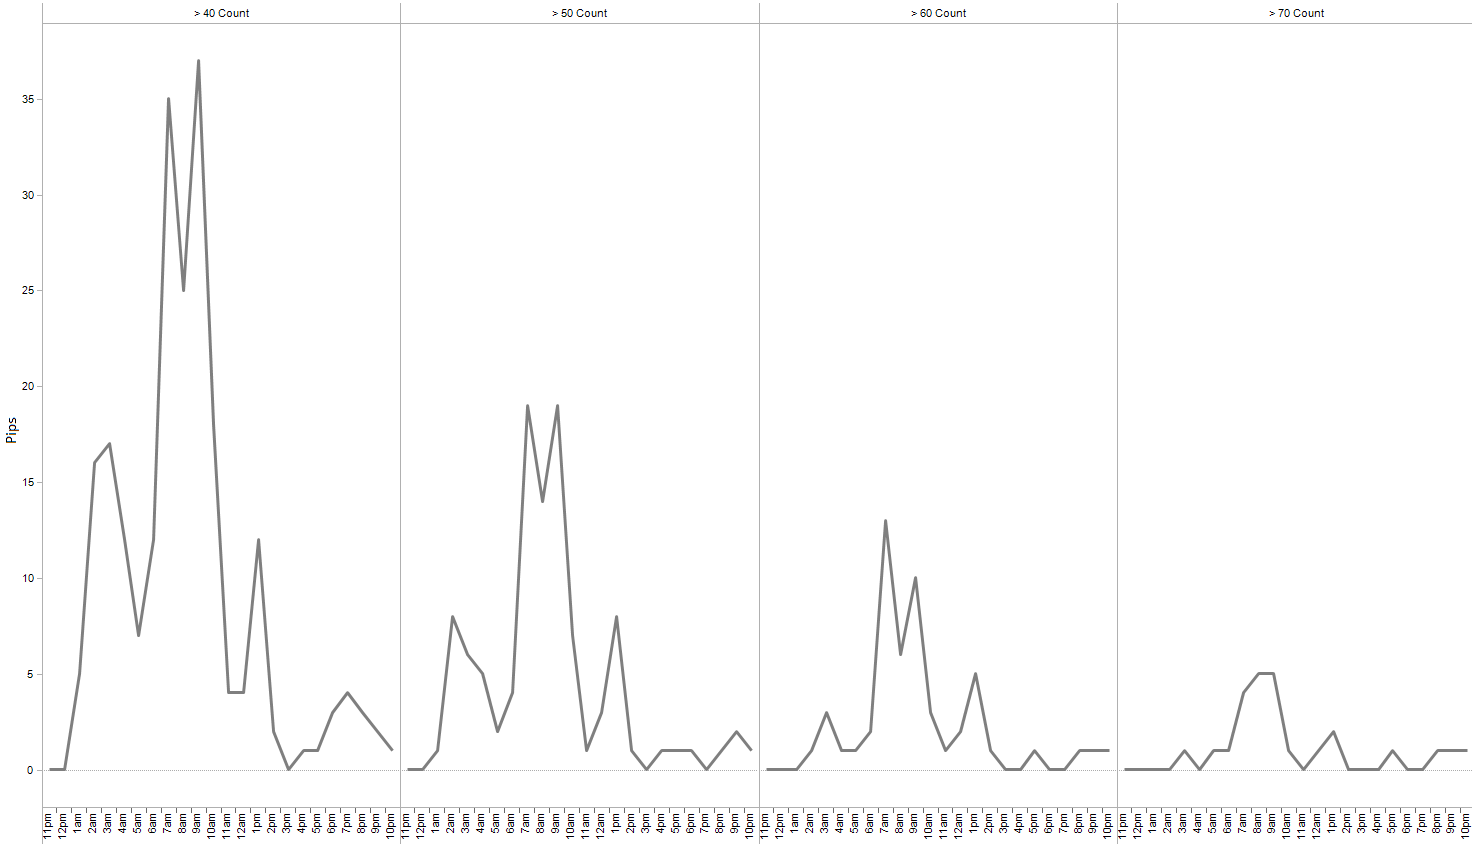
The pair is EUR/USD, Y axis is "pips", time zone is Central (-1 hour from Eastern).
The data was all the hourly data available to me which included most of 2012.
The "water drop" shaped sections are showing the frequency of occurrence, fatter means more data points contained within it.
White line is the median.
The "box" contains 50% of the data.
The resulting chart gives a better feel for what is really going on...
Life is just a journey
-
PebbleTrader
- rank: 1000+ posts
- Posts: 1633
- Joined: Fri Nov 12, 2010 2:15 am
- Reputation: 15
- Gender:
-
PebbleTrader
- rank: 1000+ posts
- Posts: 1633
- Joined: Fri Nov 12, 2010 2:15 am
- Reputation: 15
- Gender:
That is exploring the likelihood you will be able to repeatedly hit a particular range...
The likelihood of hitting larger and larger ranges for that hour decreases...
It's like trying to balance how often you are right versus how much you get paid when right.
The likelihood of hitting larger and larger ranges for that hour decreases...
It's like trying to balance how often you are right versus how much you get paid when right.
Last edited by PebbleTrader on Thu Nov 01, 2012 8:41 pm, edited 1 time in total.
Life is just a journey
-
PebbleTrader
- rank: 1000+ posts
- Posts: 1633
- Joined: Fri Nov 12, 2010 2:15 am
- Reputation: 15
- Gender:
-
gwendolynkfa
- rank: <50 posts

- Posts: 2
- Joined: Tue Oct 25, 2022 5:31 am
- Reputation: 0
- Gender:

Re: Forex pairs spread & volume statistics
Thank you michal
Please add www.kreslik.com to your ad blocker white list.
Thank you for your support.
Thank you for your support.