I have added 'pointy places' to $ZILLIONSZ, aka "aliascript", if you are interested. 'movePointy' is a setting that moves the 'pointy place' marker away from the price extreme by a number of pips, eg 0.0001.
Let me know if you think I should add it to the first post or leave the aliascript as is.
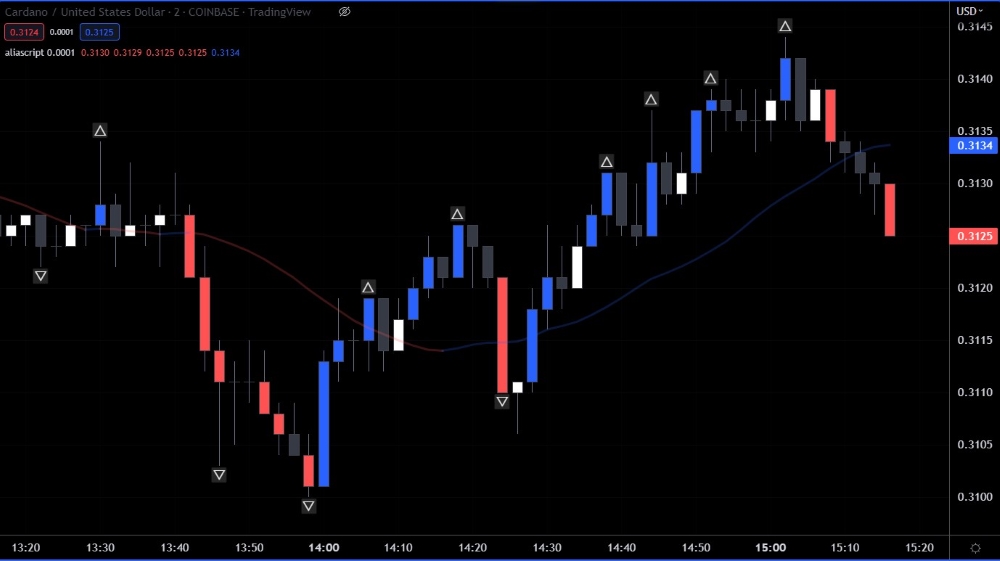
- pointyPlaces.jpg (131.65 KiB) Viewed 1465 times
Code: Select all
//@version=5
indicator(title = "$ZILLIONZ", shorttitle = "aliascript", overlay = true)
//-----Chart-Setup-----//
adj = input(0.0, "movePointy")
h = high
l = low
c = close
o = c[1]
updnCon = h[1] < c ? "up" : l[1] > c ? "dn" : "no"
updnCon := updnCon == "no" and o < c ? "white" : updnCon == "no" and o > c ? "black" : updnCon
palette = updnCon == "up" ? color.blue : updnCon == "dn" ? color.red : updnCon == "white" ? color.white :  updnCon == "black" ? color.black  : color.fuchsia
plotcandle(o,h,l,c, color = palette, wickcolor =color.rgb(107, 113, 133), bordercolor = color.rgb(66, 68, 77))
//-----Better-MA-----//
ma1 = (ta.sma(hlc3, 16) + ta.sma(hlc3, 19)[3]) / 2
sig = ta.lowest(ma1, 2) < ma1 ? color.new(color.blue,0) : ta.highest(ma1,2) > ma1 ? color.new(color.red,0) : color.new(color.black,0)
plot(ma1, color = color.new(sig,76), style = plot.style_line, linewidth = 3)

fh = h
fl = l
cond1 = close[2] > close[3] and close[2] > close[4] and close[2] > close[5] and close[2] > close[6] and close[2] >= close[1] and close[2] >= close[0] // is highest of 5, is >= 2 to the right.
cond2 = close[2] < close[3] and close[2] < close[4] and close[2] < close[5] and close[2] < close[6] and close[2] <= close[1] and close[2] <= close[0] // is lowest of 5, is <= 2 to the right.
plotchar(cond1 ? fh[2] + adj : na, char = "⬜", color = color.new(color.white,85), offset = -2, location = location.absolute, editable = false, display = display.all - display.status_line)
plotchar(cond2 ? fl[2] - adj : na, char = "⬜", color = color.new(color.white,85), offset = -2, location = location.absolute, editable = false, display = display.all - display.status_line)
plotchar(cond1 ? fh[2] + adj : na, char = "△", color = color.new(color.white,10), offset = -2, location = location.absolute, editable = false, display = display.all - display.status_line)
plotchar(cond2 ? fl[2] - adj : na, char = "▽", color = color.new(color.white,10), offset = -2, location = location.absolute, editable = false, display = display.all - display.status_line)


