Page 1 of 1
Daily Technical analysis by FreshForex
Posted: Sun Jun 12, 2016 5:20 am
by tiptip
GBP/USD Technical analysis Summary :
Target Level : 1.4451
Target Period : 4 hours
Analysis :Possible bearish price movement towards the support 1.4451 within the next 4 hours.
Supporting Indicators :Downward sloping Moving Average
Resistance Levels :( B ) 1.45554 hour high volatility level
Support Levels( A ) 1.44514 hour low volatility level
Re: Daily Technical analysis by FreshForex
Posted: Sun Jun 12, 2016 5:23 am
by tiptip
USD/CHF Technical analysis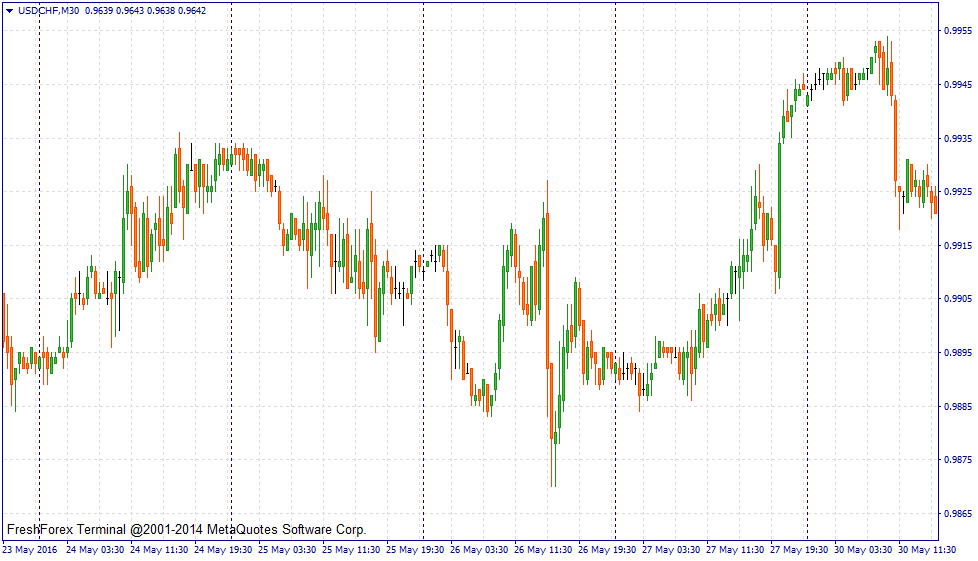 Summary :
Target Level : 0.9553
Target Period : 4 hours
Analysis :Possible bearish price movement towards the support 0.9553 within the next 4 hours.
Supporting Indicators :Downward sloping Moving Average
Resistance Levels :( B ) 0.96214 hour high volatility level
Support Levels( A ) 0.95534 hour low volatility level
Re: Daily Technical analysis by FreshForex
Posted: Sun Jun 12, 2016 5:29 am
by tiptip
USD/CAD Technical analysis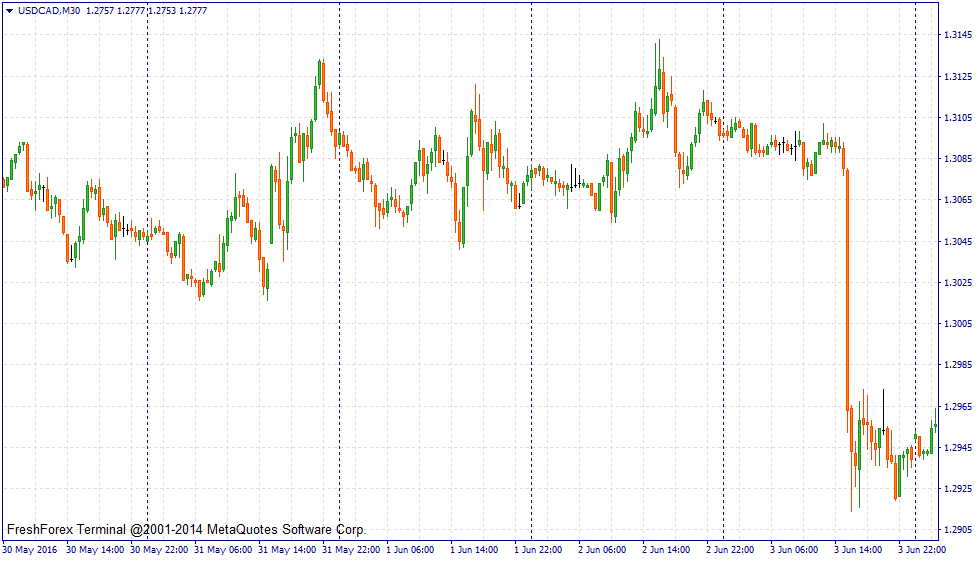 Summary :
Target Level : 1.272
Target Period : 12 hours
Analysis :Triangle identified at 09-Jun-05:00 2016 GMT. This pattern is still in the process of forming. Possible bullish price movement towards the resistance 1.272 within the next 12 hours.
Resistance Levels :( B ) 1.272Last resistance turning point of Triangle.
Support Levels( A ) 1.267Last support turning point of Triangle.
Re: Daily Technical analysis by FreshForex
Posted: Sun Jun 12, 2016 5:52 am
by tiptip
GBP/JPY Technical analysis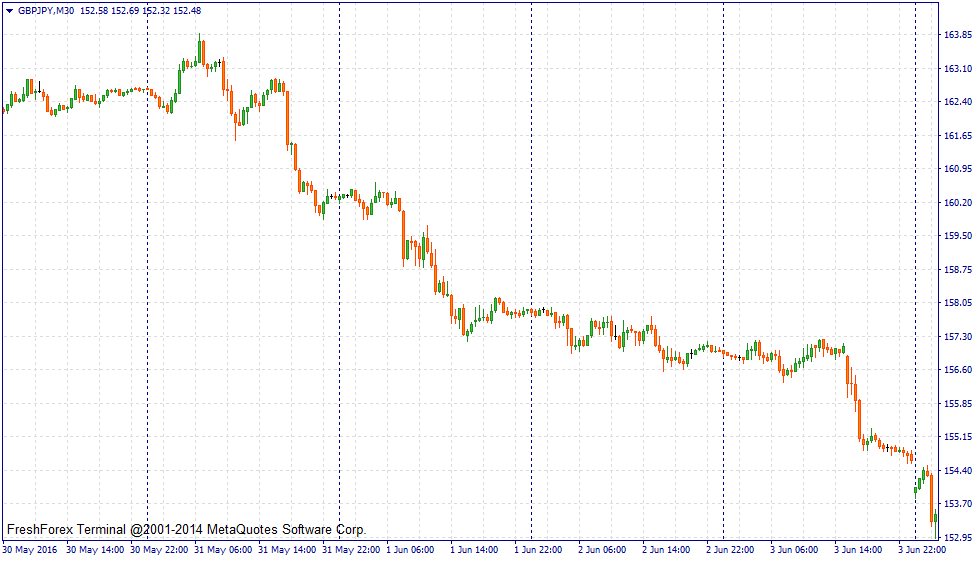 Summary :
Target Level : 156.252
Target Period : 16 hours
Analysis :Falling Wedge identified at 09-Jun-05:30 2016 GMT. This pattern is still in the process of forming. Possible bullish price movement towards the resistance 156.252 within the next 16 hours.
Resistance Levels :( B ) 156.252Last resistance turning point of Falling Wedge.
Support Levels( A ) 154.4625Last support turning point of Falling Wedge.
Re: Daily Technical analysis by FreshForex
Posted: Sun Jun 12, 2016 6:01 am
by tiptip
EUR/JPY Technical analysis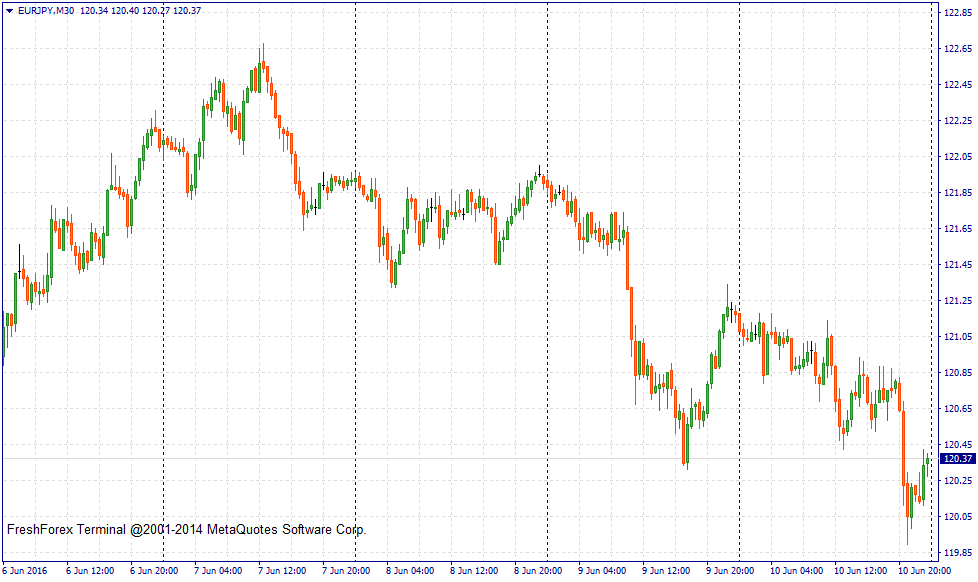 Summary :
Target Level : 122.705
Target Period : 3 days
Analysis :Triangle identified at 08-Jun-20:00 2016 GMT. This pattern is still in the process of forming. Possible bullish price movement towards the resistance 122.705 within the next 3 days.
Resistance Levels :( B ) 122.705Last resistance turning point of Triangle.
Support Levels( A ) 121.328Last support turning point of Triangle.
Re: Daily Technical analysis by FreshForex
Posted: Sun Jul 17, 2016 7:25 pm
by Razar Remon
I mostly put weight on trying to work out these things myself, but obviously I am just a beginner and it’s very half, so I am following these Forecast by FreshForex regularly and I must say it’s pretty cool!
Re: Daily Technical analysis by FreshForex
Posted: Mon Jun 12, 2017 8:25 pm
by Razar Remon
I know I have already comment on this, but I wanted to add one thing that I have seen in recent times. When in past I was using these Forecasts from FreshForex, it was very different but in recent times, it has almost grown. Now, there is another level like added which really makes it likable even more!