Page 1 of 26
NCA 2: THE CHARTBOOK
Posted: Tue Jun 28, 2022 12:58 pm
by IgazI
This is just a collection of charts that will hopefully inspire people to trade using closing prices.
- M15_S3_MATRI12.png (132.07 KiB) Viewed 8957 times
Re: NCA 2: THE CHARTBOOK
Posted: Tue Jun 28, 2022 1:34 pm
by IgazI
Gaps in the opposite direction indicate a strong change in direction. The triangular moving average works well as a trend line, if you're into that sort of thing:
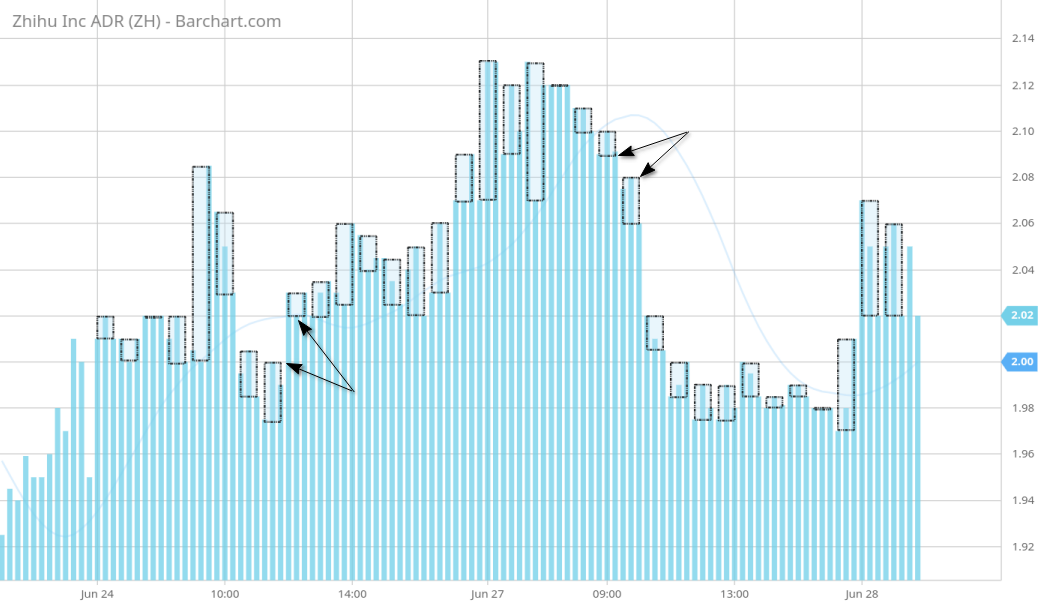
- ZH_GAP.png (129.83 KiB) Viewed 8948 times
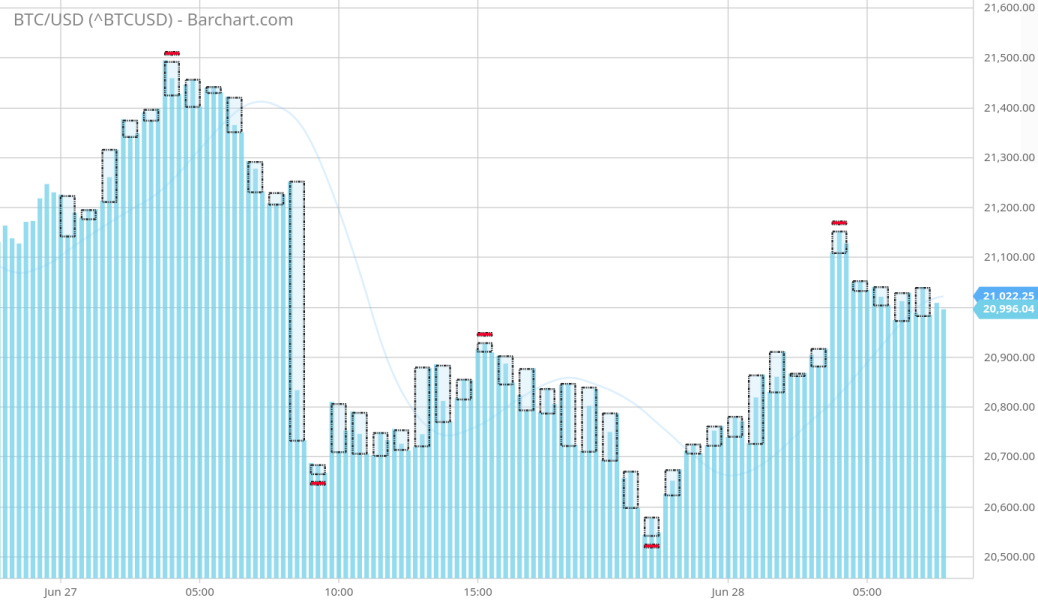
Where are the down gaps? I'm sure they're coming

- Q-where_dn_gaps.png (116.69 KiB) Viewed 8936 times
Re: NCA 2: THE CHARTBOOK
Posted: Tue Jun 28, 2022 1:56 pm
by IgazI
'2' is a line chart, '3' is basically a line chart
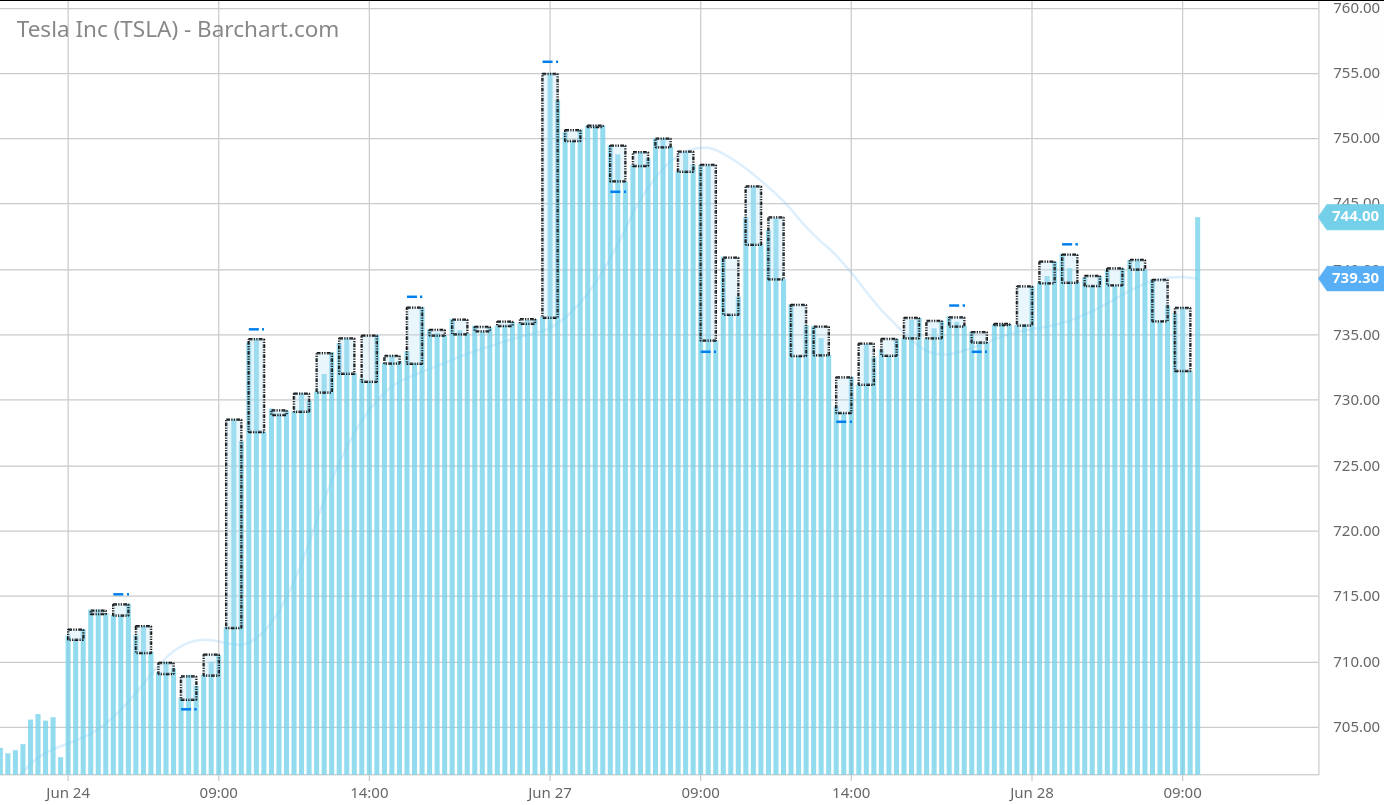
- TSLA_M15.png (117.74 KiB) Viewed 8940 times
Re: NCA 2: THE CHARTBOOK
Posted: Tue Jun 28, 2022 2:38 pm
by IgazI
Know where you are and where you are goingwhen trading small charts. Daily chart of Costco:
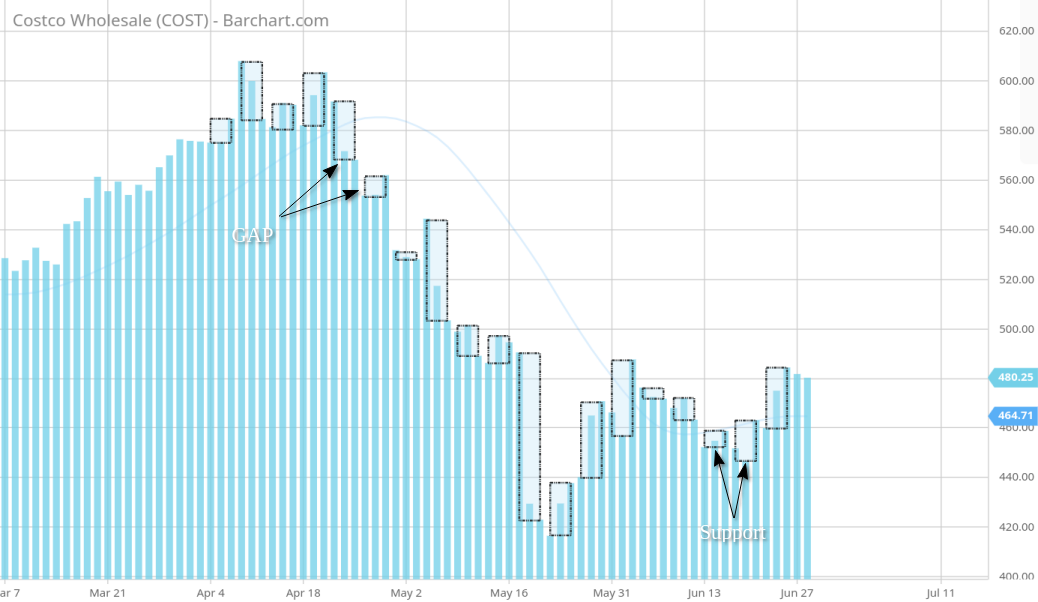
- COST_DAILY.png (115.8 KiB) Viewed 8934 times
Re: NCA 2: THE CHARTBOOK
Posted: Tue Jun 28, 2022 3:13 pm
by IgazI
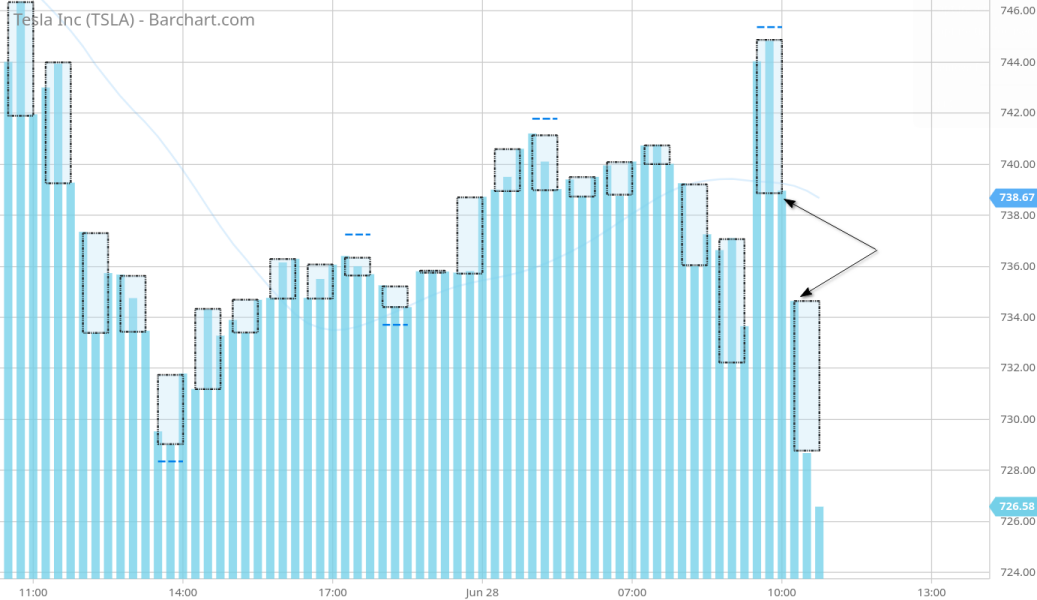
Tesla coming in with the head fake . . . Nice move
 The two things that you can do to insulate yourself from negative movement are:
 1. place trades based on 2/3 of your account:
if price moves $12 then you make or break $8. 2. use Alias' 1+1+2 entry progression:
if you're terribly wrong then you are only in it with 1/6 position sizing (-$12 = -$2) Max size when you are right, min size when you are wrong.
- head_fake.png (119.05 KiB) Viewed 8919 times
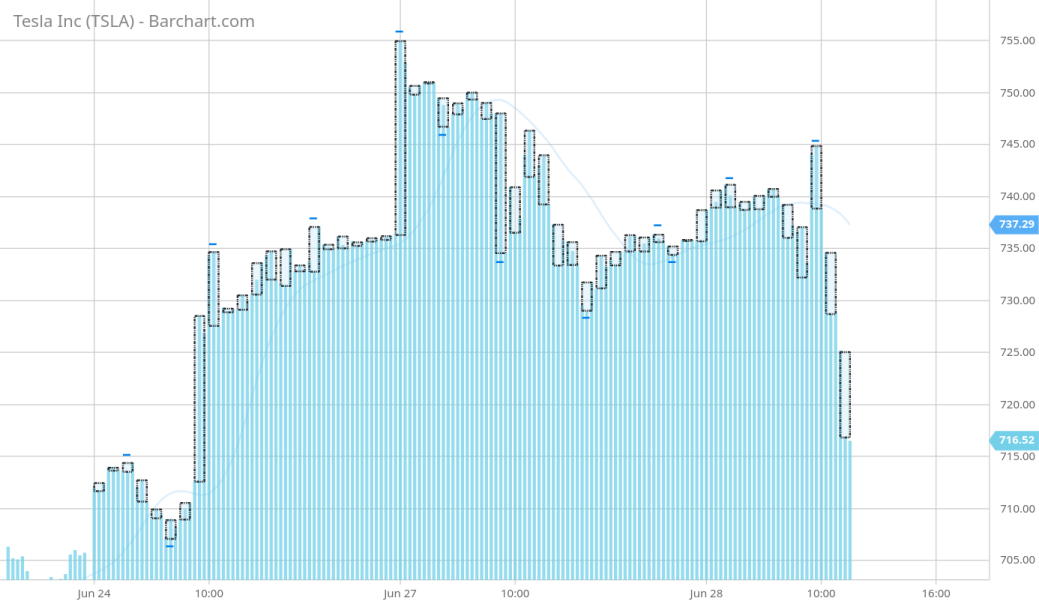
- TSLA_s.png (128.85 KiB) Viewed 8914 times
Re: NCA 2: THE CHARTBOOK
Posted: Tue Jun 28, 2022 4:28 pm
by IgazI
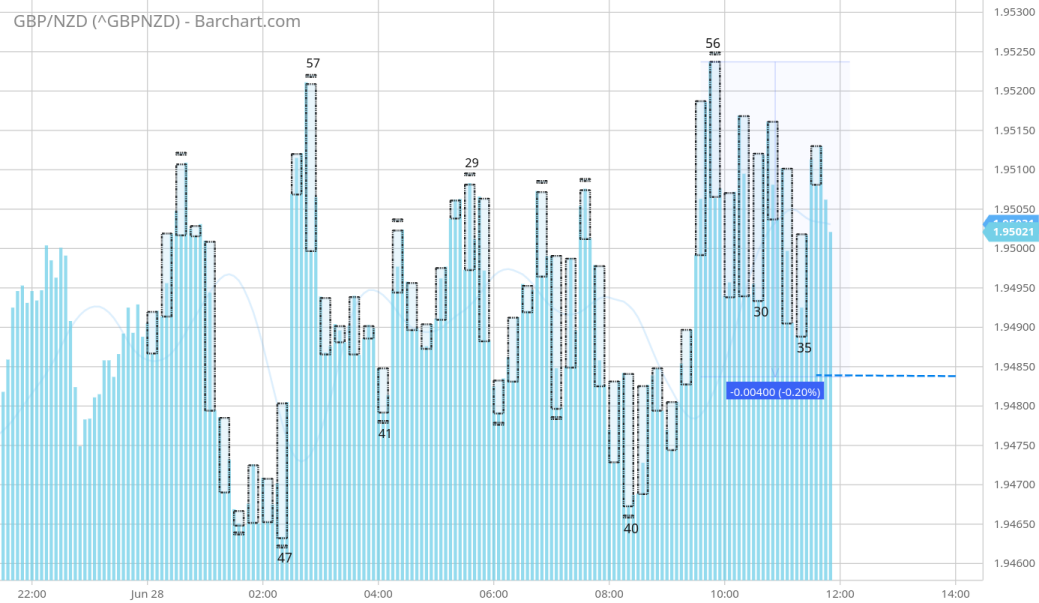
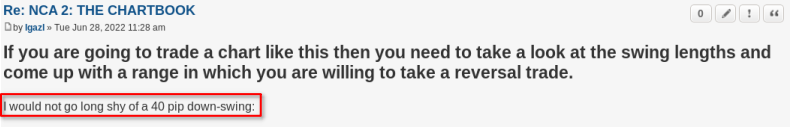
If you are going to trade a chart like this then you need to take a look at the swing lengths and come up with a range in which you are willing to take a reversal trade. I would not go long shy of a 40 pip down-swing:
5 minute chart of GBPNZD:
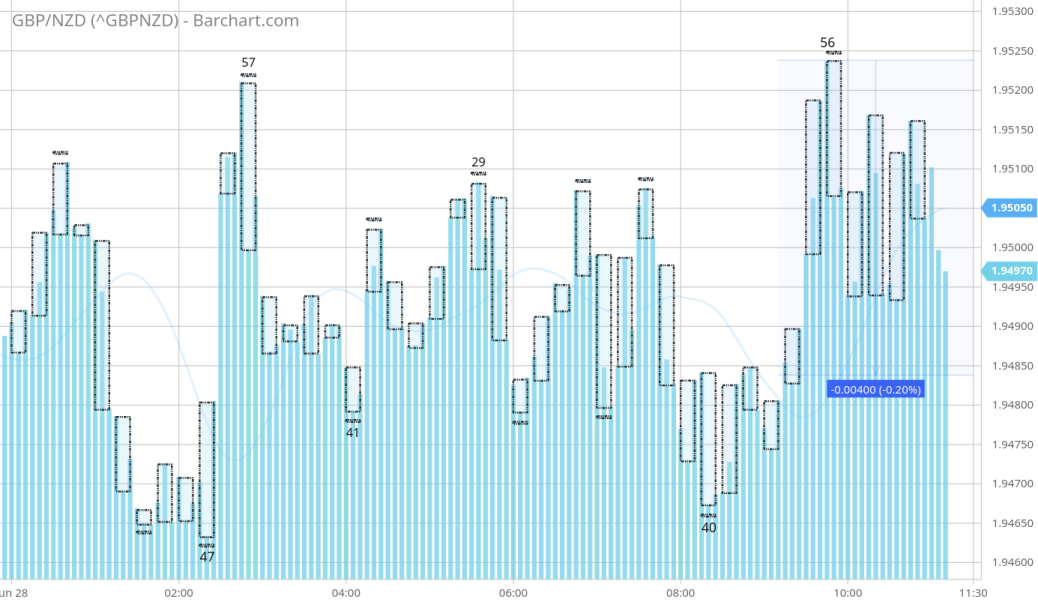
- rotten_GBPNZD.png (198.66 KiB) Viewed 8904 times
- rot.png (203.69 KiB) Viewed 8893 times
Re: NCA 2: THE CHARTBOOK
Posted: Tue Jun 28, 2022 5:41 pm
by IgazI
Re: NCA 2: THE CHARTBOOK
Posted: Tue Jun 28, 2022 6:27 pm
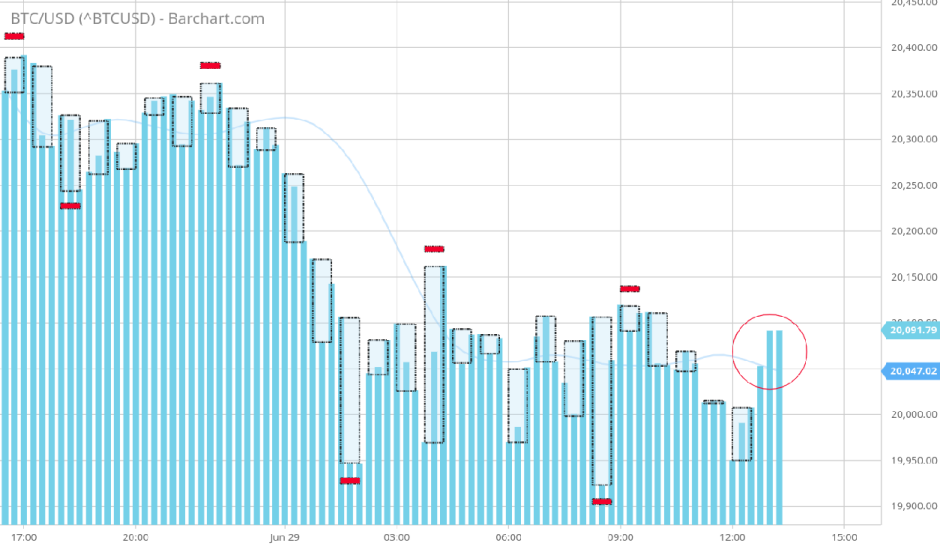
by IgazI

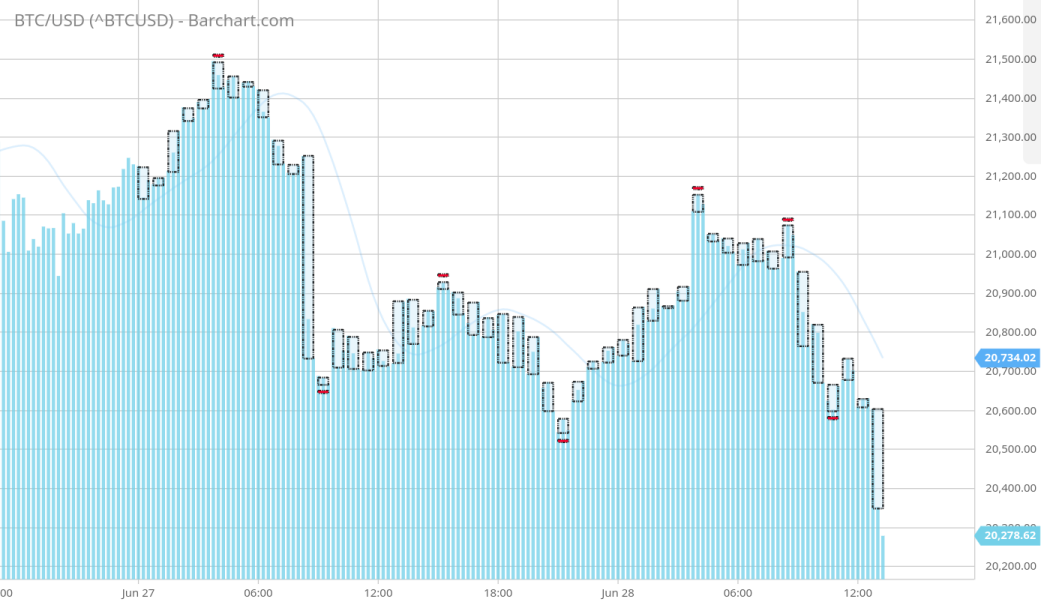
- Bitcoin_go_dn_hole.png (119.32 KiB) Viewed 8863 times
- POS.png (133.52 KiB) Viewed 8863 times
Re: NCA 2: THE CHARTBOOK
Posted: Wed Jun 29, 2022 5:58 pm
by IgazI
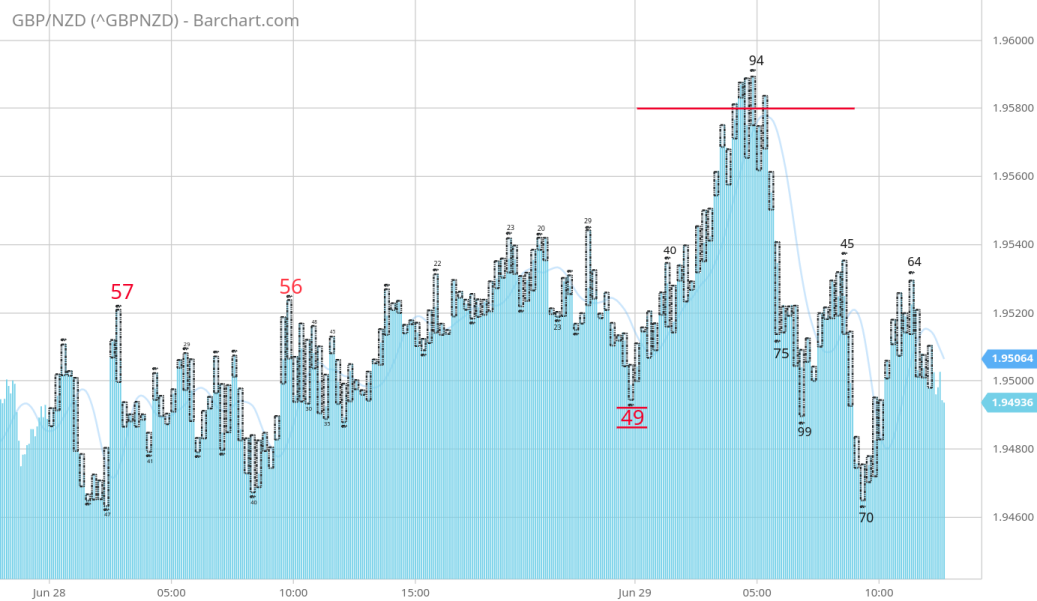
This is what I was looking for, an interrupting move, a momentum move, that is opposite the dominate direction:it is easier to see why this is what you are looking for when the swings are color coded and plotted as Baccarat chart.
With just two months of rotation statistics you could land accurate shots all day on this dragon. . .
- this_lil_doggy.png (192.56 KiB) Viewed 8668 times
- note.png (45.82 KiB) Viewed 8665 times
Re: NCA 2: THE CHARTBOOK
Posted: Wed Jun 29, 2022 7:06 pm
by IgazI
Remember, these are not candles! you are not waiting for 'boxes to close':
The sea of closes is simplified into frames so that you can better grasp the history of the underlying price movement; we are still using the individual closes to take action.
- action.png (114.05 KiB) Viewed 8653 times
