Page 1 of 11
All things TradingView
Posted: Fri May 25, 2018 6:59 am
by IgazI
If you use the platform and want to post TV charts or code then you can do so here.
I just signed up here to get up to speed:
- Tcn.png (101.56 KiB) Viewed 10363 times
Re: All things TradingView
Posted: Wed May 30, 2018 5:51 pm
by nat
anyone using trading view keep having drawings disappear? ive tried saving chart and they still disappear, kind of aggravating
Re: All things TradingView
Posted: Thu May 31, 2018 3:49 pm
by IgazI
nat wrote:anyone using trading view keep having drawings disappear? ive tried saving chart and they still disappear, kind of aggravating
It saves every minute so you have to manually click the 'cloud' before you leave.

- click_here.png (4.76 KiB) Viewed 10253 times
Midpoints
Posted: Thu May 31, 2018 4:52 pm
by IgazI
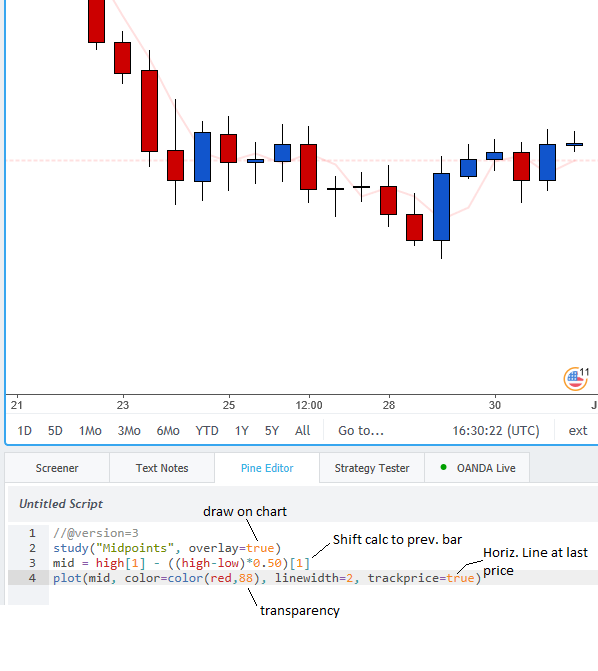
- midpoint_example.png (24.31 KiB) Viewed 10243 times
Re: All things TradingView
Posted: Sat Jun 02, 2018 1:27 pm
by IgazI
I have been spending hours trying do draw two lines and then color in the space

I can do:
hline(input_1)
hline(input_2)
but what I can't do is:
hline(open[9])
hline(low[9])
because hline() doesn't accept a series and I have not found a way to access data in a series eg x = open[9], y = x[0]
Anyone have any ideas?

- how.png (21.94 KiB) Viewed 10176 times
Re: All things TradingView
Posted: Sat Jun 02, 2018 2:55 pm
by nat
IgazI wrote:I have been spending hours trying do draw two lines and then color in the space
I can do:
hline(input_1)
hline(input_2)
but what I can't do is:
hline(open[9])
hline(low[9])
because hline() doesn't accept a series and I have not found a way to access data in a series eg x = open[9], y = x[0]
Anyone have any ideas?
how.png
Maybe get it to draw a rectangle. where one coordinate is the bottom left corner and the other is the top right 5 bars ahead of most current bar. Rectangles have shaded areas by default in tradingview, not sure if it would be like that coding wise also
Posted: Mon Jun 04, 2018 6:32 pm
by IgazI
I am still working on a better solution...I just wanted to see it actually paint what I want on the chart


- v_isfor_victory.png (30.54 KiB) Viewed 10102 times
TRO RAT ZONE
Posted: Mon Jun 04, 2018 7:13 pm
by Vasilis
dear sir
I have a question about your indicator TRO RAT ZONE ,whish i already have.
What does " Strong LWP" mean ?
As, I indicate with red arrow on the attachment chart.
Thank you very much
Vasilis
Re: TRO RAT ZONE
Posted: Mon Jun 04, 2018 7:22 pm
by IgazI
Vasilis wrote:dear sir
I have a question about your indicator TRO RAT ZONE ,whish i already have.
What does " Strong LWP" mean ?
As, I indicate with red arrow on the attachment chart.
Thank you very much
Vasilis
Your post is off topic.
Please locate any of TRO's threads and ask your question there.
Re: All things TradingView
Posted: Tue Jun 05, 2018 3:04 am
by IgazI
Here is what I have so far...you enter the high price of the bar you want your WZ to be drawn on:

- WZ.png (8.13 KiB) Viewed 10041 times
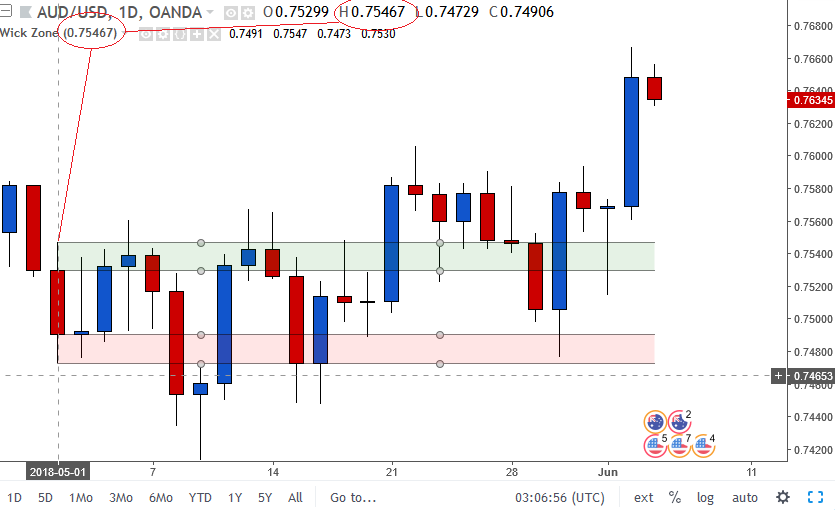
- itworks.png (32.37 KiB) Viewed 10041 times
UPDATE_1:
Code: Select all
//@version=3
study("Wick Zone", overlay=true, max_bars_back=0)
HIGH = security(tickerid, "D", high)
LOW =  security(tickerid, "D", low)
OPEN =  security(tickerid, "D", open)
CLOSE =  security(tickerid, "D", close)
x = input(defval = 0.76666, title="HIGH OF BAR")
isclose = valuewhen(HIGH == x, CLOSE, 0)
isopen = valuewhen(HIGH == x, OPEN, 0)
dwn = isclose < isopen ? 1 : 0

getopen = dwn ? valuewhen(HIGH == x, CLOSE, 0) : valuewhen(HIGH == x, OPEN, 0)
gethigh= valuewhen(HIGH == x, HIGH, 0)
getlow = valuewhen(HIGH == x, LOW, 0)
getclose = dwn ? valuewhen(HIGH == x, OPEN, 0) : valuewhen(HIGH == x, CLOSE, 0)

plot1 = plot(getopen, linewidth=1, color=color(black,50))
plot2 = plot(gethigh, linewidth=1, color=color(black,50))
plot3 = plot(getlow, linewidth=1, color=color(black,50))
plot4 = plot(getclose, linewidth=1, color=color(black,50))

fill1 = fill(plot2,plot4, color(green,90))
fill2 = fill(plot3,plot1, color(red,90))