Indicators that change price and those based apon a fixed price serve a simular function...
They give traders the area's or 'zones' that they may trade away from, or towards to...\\depnds on your level of experience and frame of mind//
Economists also like to place a lot of weight on moving averages to gauge longer term Market sentiment...
50SMA Closing under 200SMA = Death Cross
Personally I like the 108LWMA as it likes to reject price on all time frames... Its 'flat enough' to be considered a 'horizontal line' if price hits it,
and then you just apply the same close above close under logic...
I've been playing around with some older indicators (seems they don't make em like they used to)
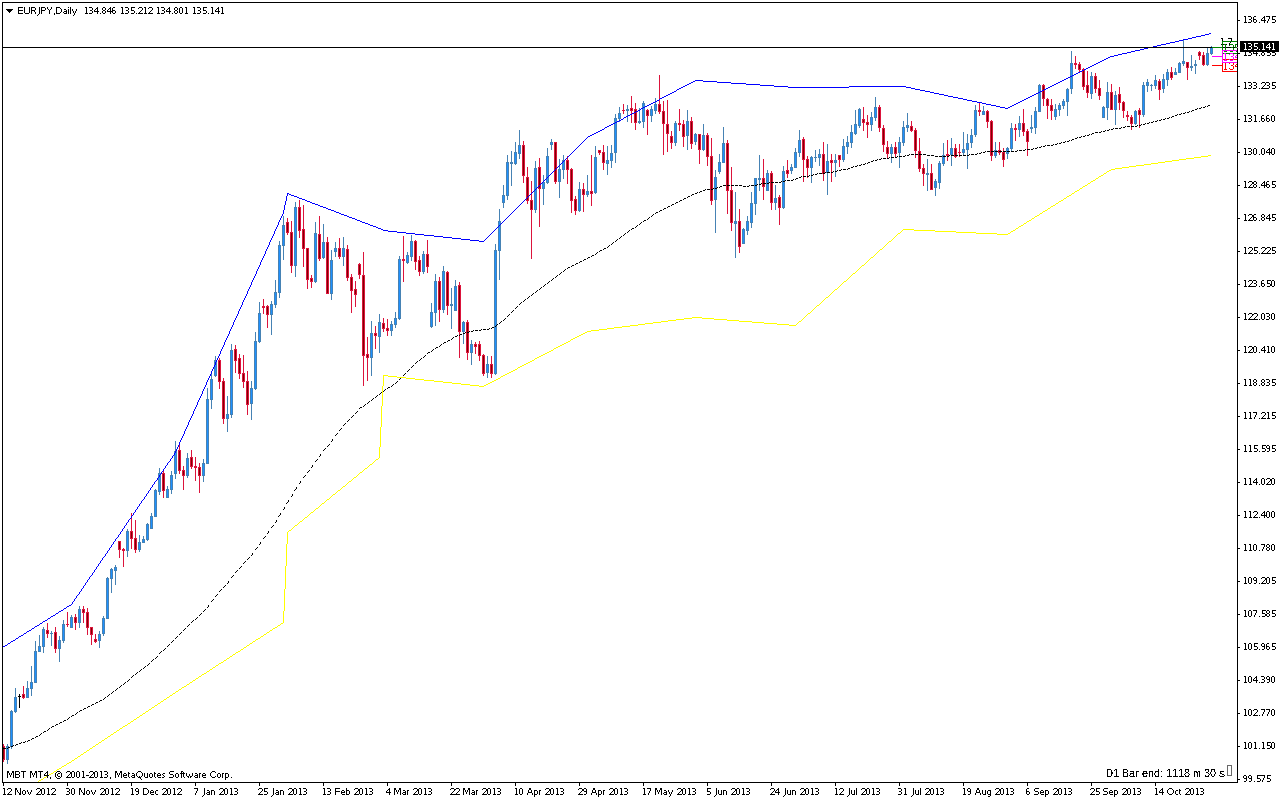
and I've just developed this way of looking at daily price action. Still in Alpha...
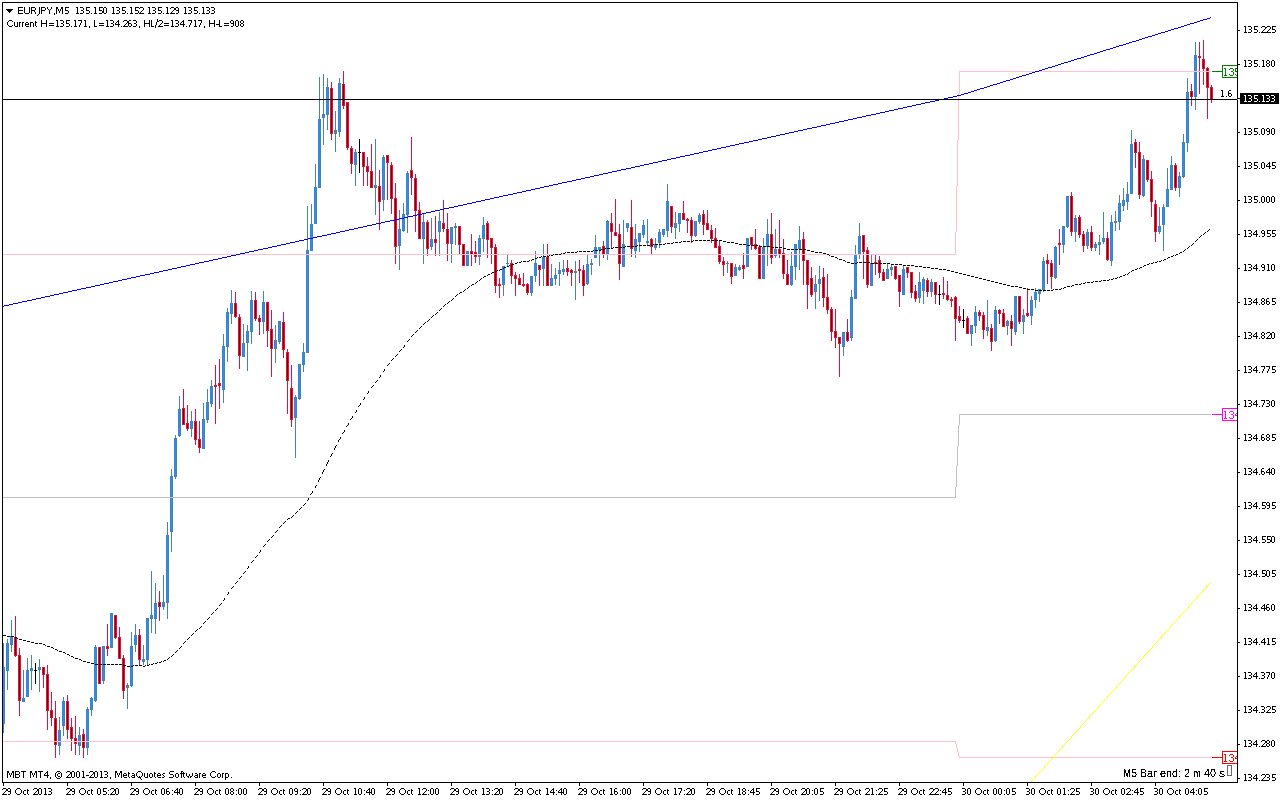
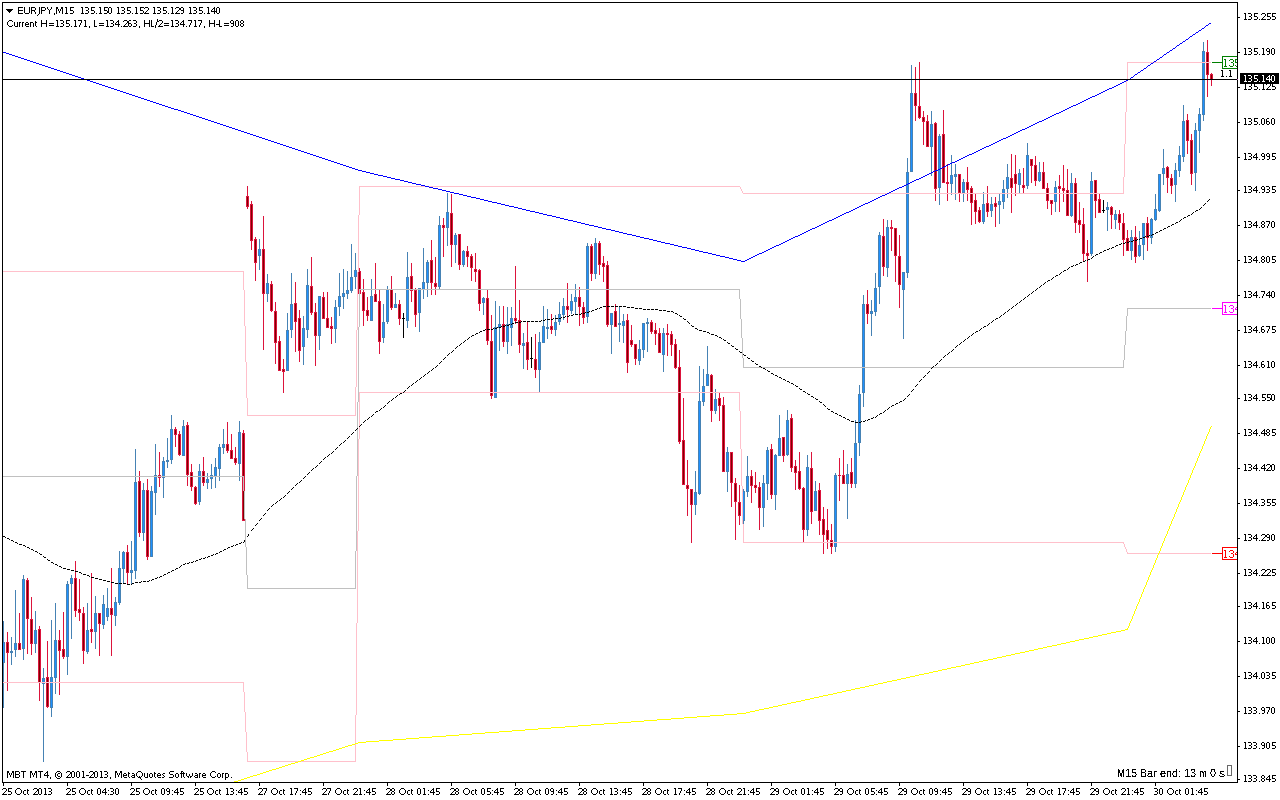
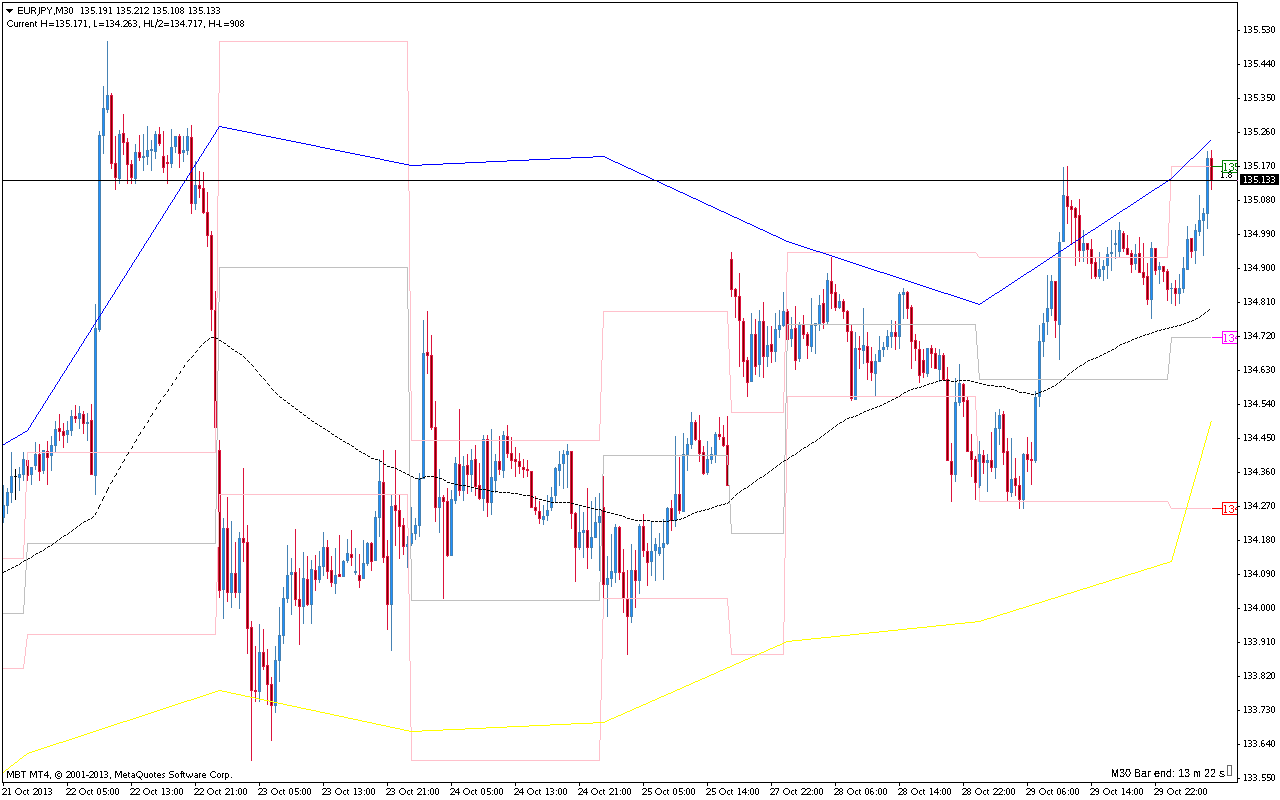
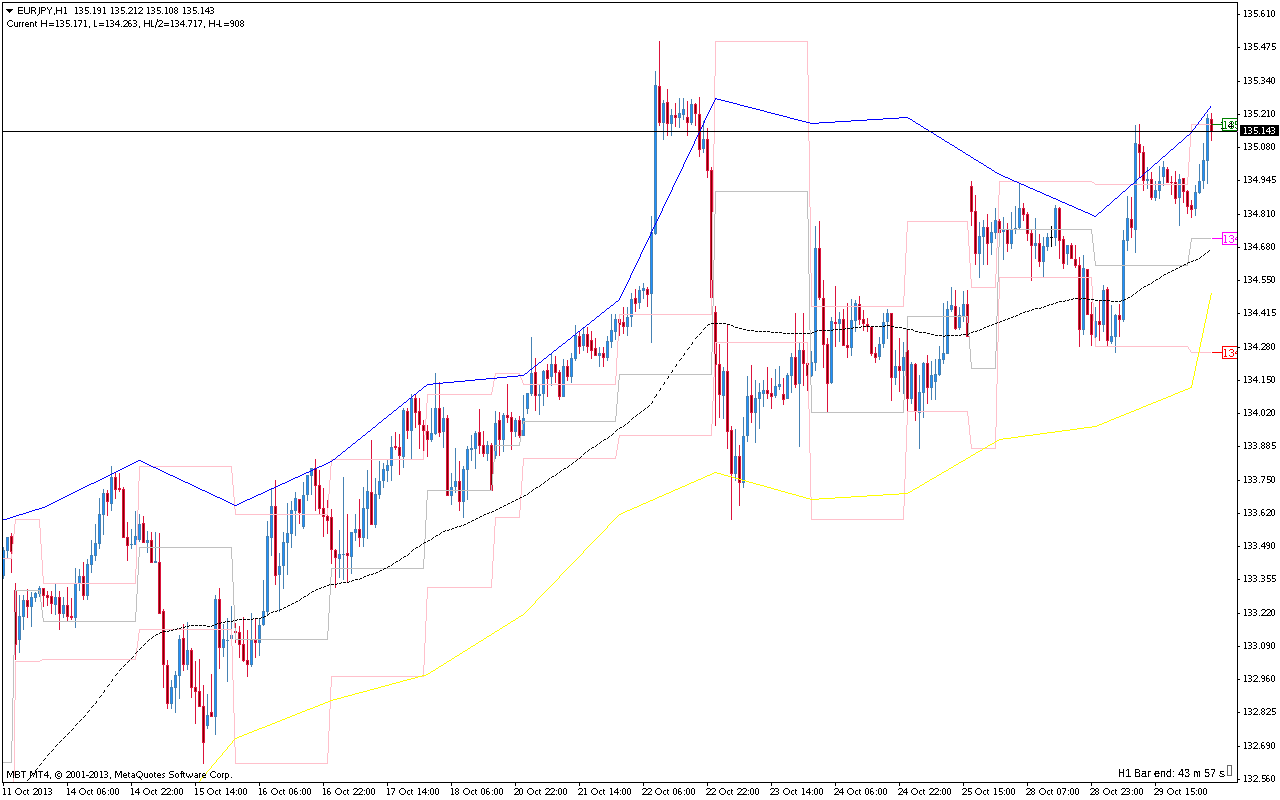
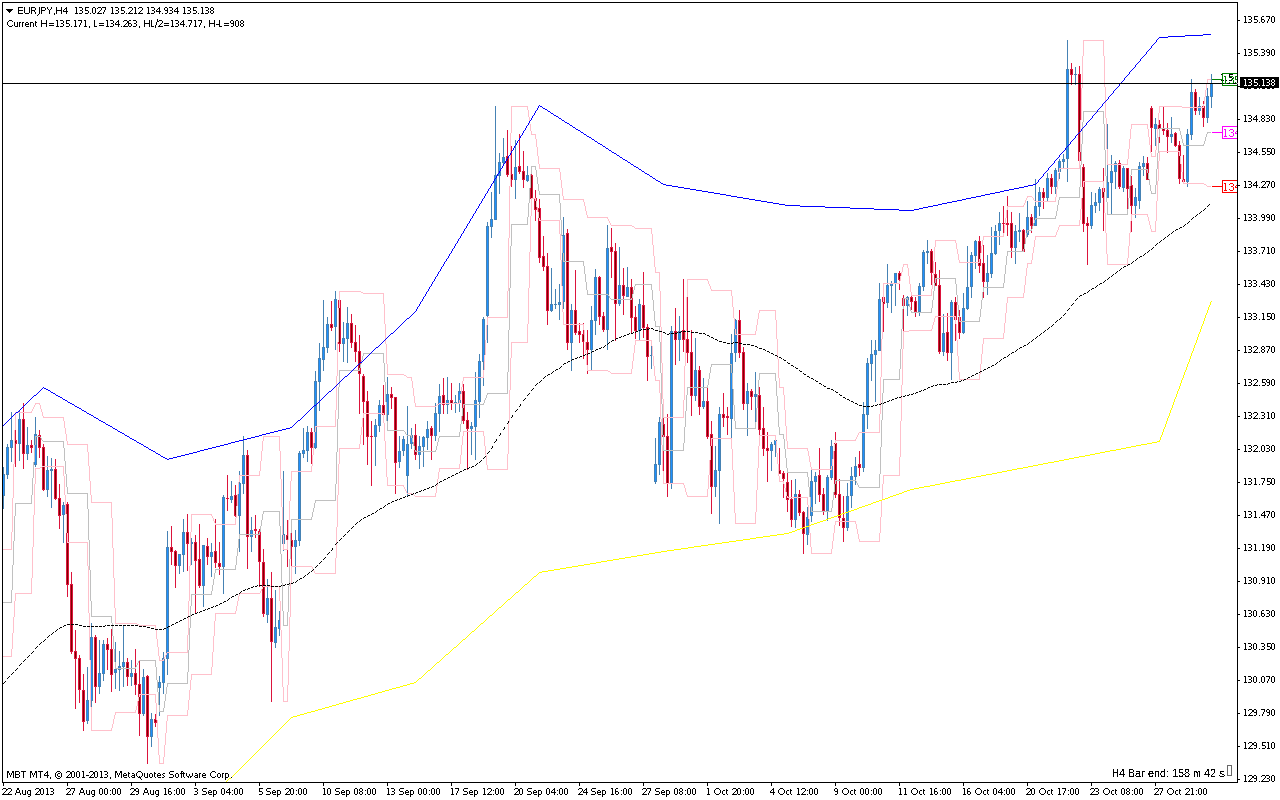
Pro may like this... But anyway, here is a combo of a 108LWMA, Daily Hi/Low/Mid,
Din Fibs (which is an annoying indicator as it keeps crashing my system - But it creates the High and Low Channel),
and one or two TRO indi's for Time and Prices...
So yeah I totally see your point TRO...
The lines change...
And from a chartists point of view it frustrates the bejeezuz out of me because I can't code a little alarm that goes
ting everytime
a MA gets hit (or within x pips of) on a multiple time frame
(because they all have some relevance) to draw my attention to it...
It literally means I have to keep flipping through the charts and
noting where price is relative to these key levels being created by the inidcator...