Page 1 of 2
ZigZag Point & Figure charts
Posted: Thu Jul 04, 2013 9:52 pm
by MightyOne
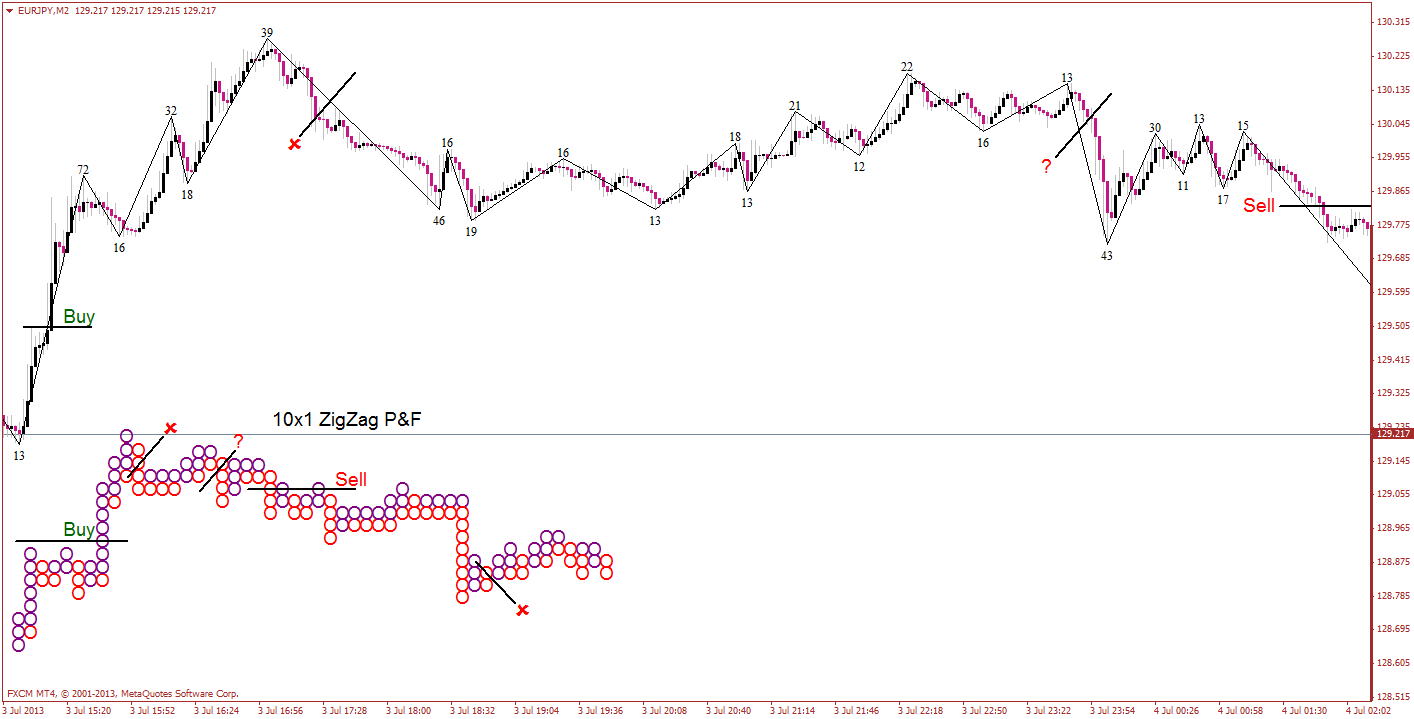
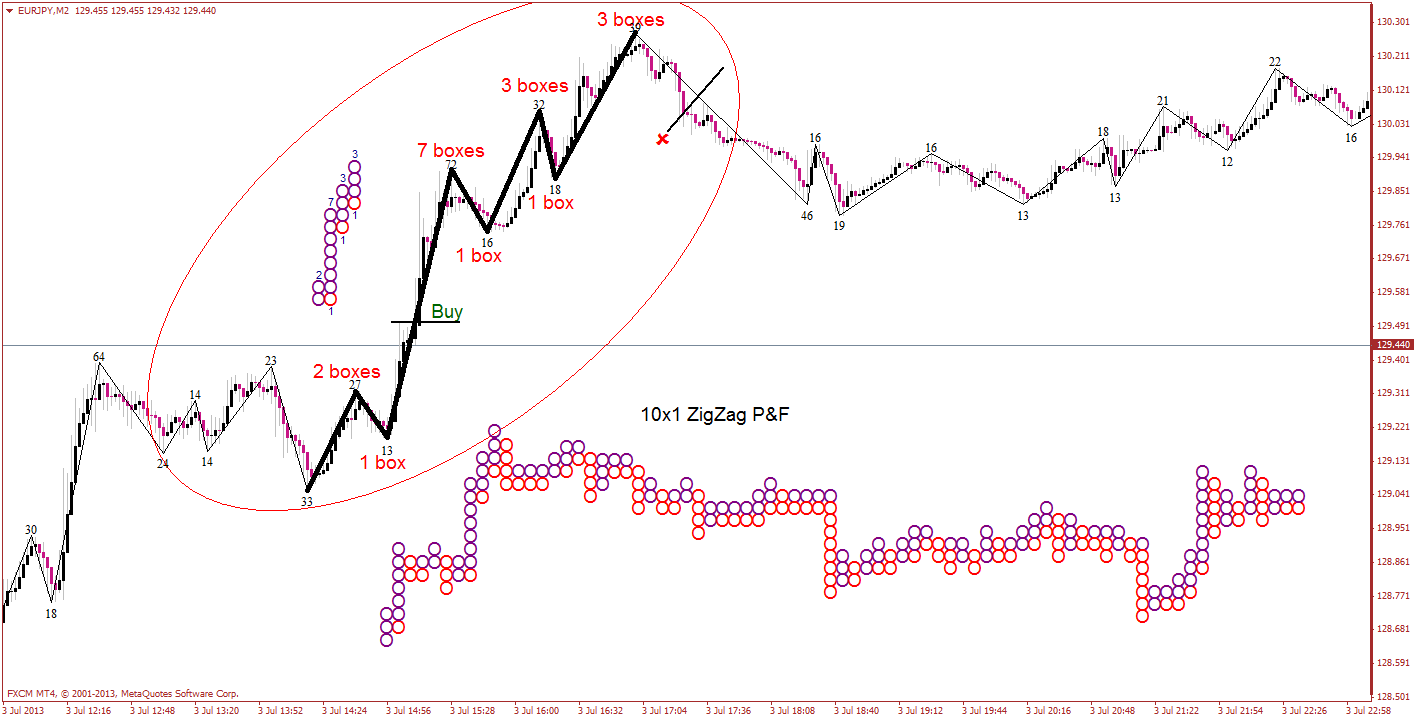
I plot the number of boxes in each swing.
The boxes rise and fall from pivots and not with exact prices, but it tends to all balance out.
You should use one box reversals with this as ZigZag already filters price, but no one is going to stop you from recording a multi-box reversal.
It is very easy to plot by hand thanks to PebbleTrader's ZigZag indicator.
Posted: Fri Jul 05, 2013 9:16 am
by bettlebox
Hi Mo
Is it possible you can define (visually) what a "one box" reversal looks like on PnF.
Im having trouble seeing it.
Thank you.
Posted: Fri Jul 05, 2013 4:31 pm
by MightyOne
One box reversals have a special rule that a column cannot contain a single box.
What I am measuring here are the swings from the pivots, in Point & Figure, instead of movements to exact prices.
A 10x2 would hide a lot of the sideways action but the real picture is that price was just moving sideways...
Posted: Fri Jul 05, 2013 4:57 pm
by PebbleTrader
I had been adventuring through Grand Tetons, Yellowstone and Glacier areas, very fascinating areas and landscapes.
I use that viz without the zig zag lines (turned off) and it is nearly the same as a PnF chart but I like to see the time axis which is why I believe this is better than just a PnF chart and simpler...
Glad to see others using it as well

Posted: Fri Jul 05, 2013 5:05 pm
by PebbleTrader
Please check it manually.
If I remember correctly, it wouldn't work properly under some settings.
Not sure if I ever fixed it or it worked properly with the settings I use.
Posted: Fri Jul 05, 2013 5:15 pm
by MightyOne
PebbleTrader wrote:Please check it manually.
If I remember correctly, it wouldn't work properly under some settings.
Not sure if I ever fixed it or it worked properly with the settings I use.
I noticed that, that is why I leave it set at 653 =)
Currently, I use candles that close at the 2 SMA (a close at the typical price is also being explored).
I guess that I am never happy with how data is presented

Posted: Sat Jul 06, 2013 4:31 pm
by roctao
I found this indicator for mt4. The cool thing is it automatically shows you "something".

Posted: Sat Jul 06, 2013 5:21 pm
by MightyOne
-REMOVED-

Posted: Sun Jul 07, 2013 6:43 pm
by MightyOne
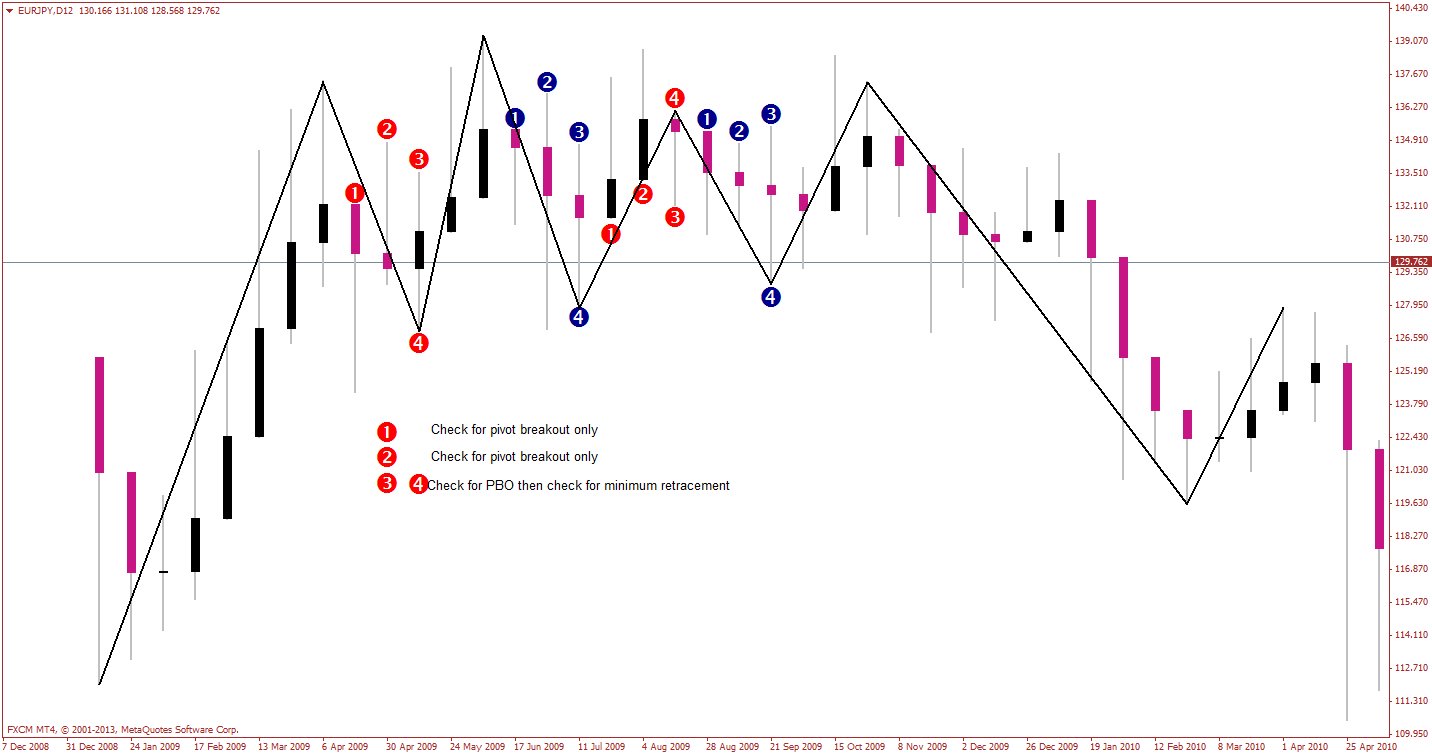
I'm thinking about a zigzag that is something like this:
Posted: Mon Jul 08, 2013 6:50 pm
by MightyOne
So far I favor the 6, 0, 3 ZigZag with a minimum reversal of 5 or 10 pips.
I have been plotting the swings of the ZigZag (not moves to exact prices) and here is the difference:
Say that I am plotting a 10x1 P&F and price is at 1500. Price can swing all the way up to 1509 and all the way down to 1491, making 18pt swings, without triggering any new boxes; and the problem gets worse the larger the box gets.
By plotting P&F, using the length of the swing, you exchange price level accuracy for greater detail of price movement history; assuming that you stick with one box reversals.
PS: All of my ZigZags have been applied to 2 minute charts.