2009.03.10 2 Patterns of Market Behavior
Posted: Tue Mar 10, 2009 5:02 am
2009.03.10 2 Patterns of Market Behavior
Although there are other 'regular' phenomena that can be observed on all time frames, I am using two of them in my personal approach - so I will incorporate their discussion in the thread - or better leave you with possible ideas behind constructing an edge for yourself.
If you find a specific repeating pattern in the market, you can assume that it will happen with higher frequency in lower time frames. Although you would gain more opportunities by looking at the lower time frame, each opportunity yields a smaller return on average compared to looking at the same pattern, one or more time frames up in the scale. That is a point worth considering in terms of your possible style of trading.
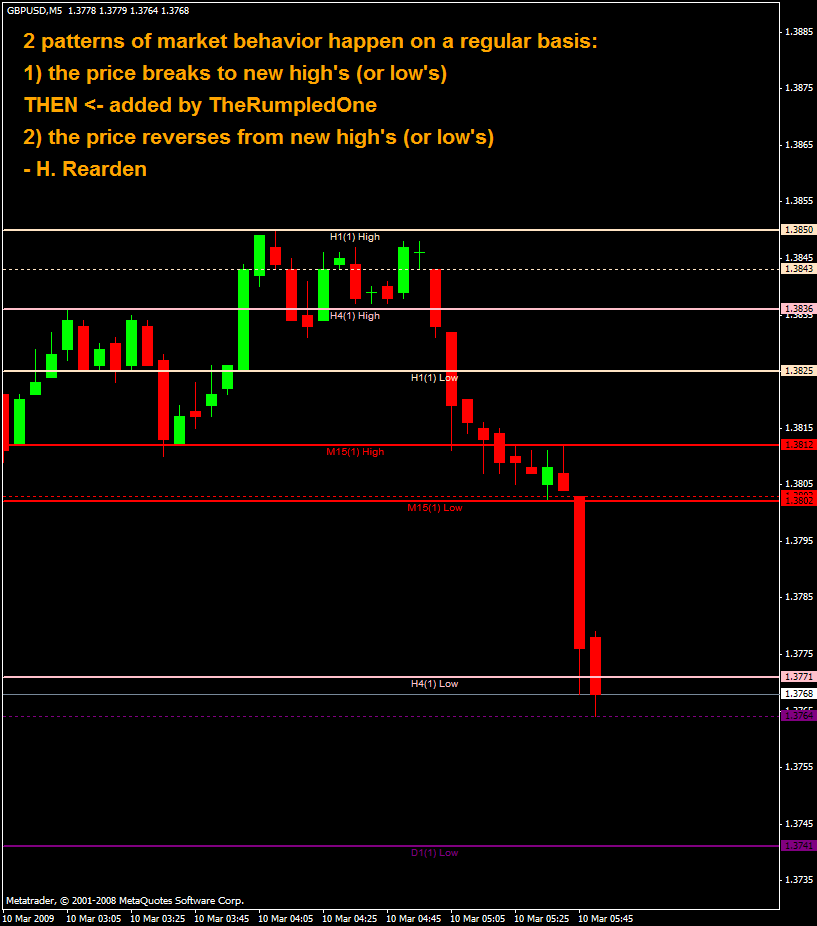
Now, 2 patterns of market behavior happen on a regular basis:
1) the price breaks to new high's (or low's)
2) the price reverses from new high's (or low's)
They happen regardless of time frame (with the obvious limitations explained above)
They are phenomena that can be exploited without the fear if found out by others, that they might cease to exist.
H. Rearden
I found the above
HERE
TRO_PLOT will plot the open, high, low and/or close. There are user inputs for which price, color, bar shift, line style, etc...
FREE MT4 version of TRO_PLOT, including SOURCE CODE and TEMPLATE, is attached.
I also threw in another indicator but you'll have to download to find out what it is.
PLEASE DO NOT POST MY INDICATORS ANYWHERE but feel free to post charts that use my indicators everywhere
Although there are other 'regular' phenomena that can be observed on all time frames, I am using two of them in my personal approach - so I will incorporate their discussion in the thread - or better leave you with possible ideas behind constructing an edge for yourself.
If you find a specific repeating pattern in the market, you can assume that it will happen with higher frequency in lower time frames. Although you would gain more opportunities by looking at the lower time frame, each opportunity yields a smaller return on average compared to looking at the same pattern, one or more time frames up in the scale. That is a point worth considering in terms of your possible style of trading.
Now, 2 patterns of market behavior happen on a regular basis:
1) the price breaks to new high's (or low's)
2) the price reverses from new high's (or low's)
They happen regardless of time frame (with the obvious limitations explained above)
They are phenomena that can be exploited without the fear if found out by others, that they might cease to exist.
H. Rearden
I found the above
HERE
TRO_PLOT will plot the open, high, low and/or close. There are user inputs for which price, color, bar shift, line style, etc...
FREE MT4 version of TRO_PLOT, including SOURCE CODE and TEMPLATE, is attached.
I also threw in another indicator but you'll have to download to find out what it is.
PLEASE DO NOT POST MY INDICATORS ANYWHERE but feel free to post charts that use my indicators everywhere