Page 1 of 2
Buy Zone Indicator Download
Posted: Sat May 15, 2010 12:16 am
by tfg
Can anyone please enlighten me where I can download the set of indicators for the BUY ZONE method?
I trawled thru the forum and must raise hand! Thanks.
tfg
Posted: Sat May 15, 2010 12:39 am
by TheRumpledOne
Posted: Sat May 15, 2010 9:06 am
by tfg
Thanks, TRO. I trawled thru all motherlodes.
Out of these four listed for BUY ZONE you mentioned in another thread,
TRO SAK MULTIPAIR
TRO PRICE EZ
TRO RANGE EZ
TRO BUYZONE
I can only find
TRO_RANGE.mq4 and TRO_BuyZoneTime.mq4.
TRO, am I looking at the correct indicators? Can you confirms what are required for the BUYZONE. Thanks very much.
Tfg
Posted: Sat May 15, 2010 9:35 am
by bredin
Look For TRO_BZ_Skyline or BZ_Skyline
G.
Posted: Sat May 15, 2010 1:51 pm
by tmanbone
tfg wrote:Thanks, TRO. I trawled thru all motherlodes.
Out of these four listed for BUY ZONE you mentioned in another thread,
TRO SAK MULTIPAIR
TRO PRICE EZ
TRO RANGE EZ
TRO BUYZONE
I can only find
TRO_RANGE.mq4 and TRO_BuyZoneTime.mq4.
TRO, am I looking at the correct indicators? Can you confirms what are required for the BUYZONE. Thanks very much.
Tfg
The TRO_BuyZone Time has user definable time periods, the other above mentioned indies are independent of the buy zone.
Posted: Sat May 15, 2010 11:08 pm
by tfg
Thanks, guys. I found TRO_BuyZoneTime.mq4 (first chart above)and TRO_BZ_skyline (second chart above). I loaded them on DTB_Rev 9 template.
Can you kindly run your eyes on them and see if they look correct.
So, which is really the BUY ZONE indi? I guess TRO_BuyZoneTime.mq4?
Once again, thanks for all your input. tfg
Posted: Sat May 15, 2010 11:43 pm
by tmanbone
Looks like the rat methodology. I see sweet spots and high lows of the last 6 or so bars. Zoom in with a chart pic, post one with the H1 buy zone on the M15. What are the vertical lines? What does better volume tell you?
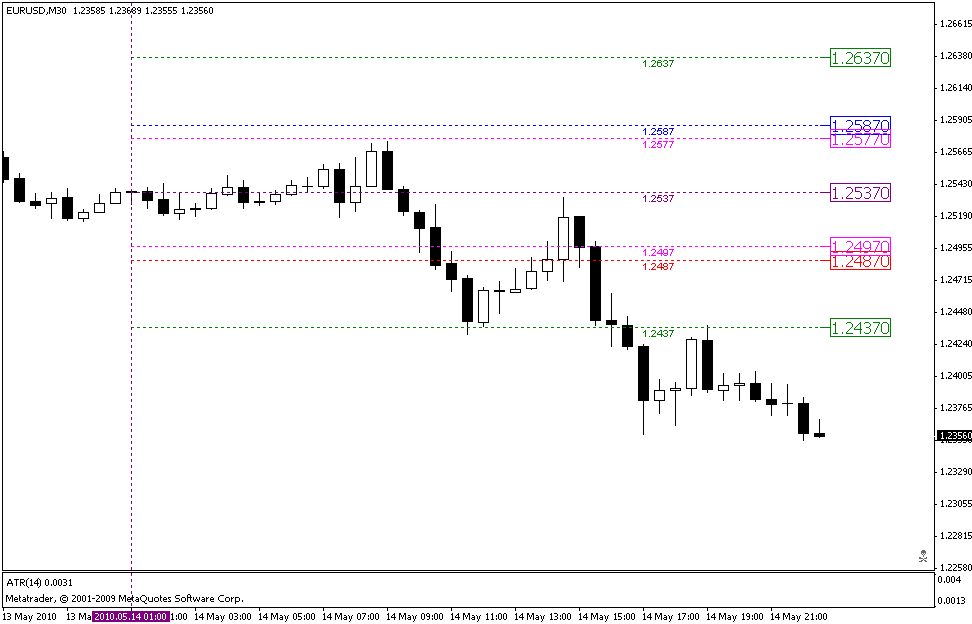
Posted: Sun May 16, 2010 12:01 am
by tfg
tmanbone wrote:Looks like the rat methodology. I see sweet spots and high lows of the last 6 or so bars. Zoom in with a chart pic, post one with the H1 buy zone on the M15. What are the vertical lines? What does better volume tell you?
tmanbone,
See attached chart. I remove the DTB-Rev9 template and only loaded the tro_buyzone_time.mq4 indi.
Does it look correct? Thanks.
tfg
Posted: Sun May 16, 2010 12:11 am
by tmanbone
TRO_BuyZone_Time plots open entry and target. I would learn how to nail this basic setup before adding anything else to my charts. Study this chart and tell us where you would have entered and exited. This will let us know where you are in your understanding. Cheers,
PS
I can't make out the dark colored charts, for posting purposes you may want to consider lightening up a shade or two.
Posted: Sun May 16, 2010 1:01 am
by tfg
tmanbone wrote:TRO_BuyZone_Time plots open entry and target. I would learn how to nail this basic setup before adding anything else to my charts. Study this chart and tell us where you would have entered and exited. This will let us know where you are in your understanding. Cheers,
PS
I can't make out the dark colored charts, for posting purposes you may want to consider lightening up a shade or two.
Thanks, tmanbone.
Any tips to save a bigger and clearer chart from MT4. I used the "save as picture" in mt4 but the image ended up uploading is not as big, nor as clear as yours? Thanks. tfg