Page 1 of 4

Bettleboxs Journey

Posted: Sat Mar 20, 2010 11:42 am
by bettlebox
Hi in effort to central my post i have made this thread and here links to important pervious threads so far. All my post will be made here from now on. As people have pointed out it will make it easrier to track my progress and possible help people in future.

What i learnt about Time and Price today
http://kreslik.com/forums/viewtopic.php?p=36285#36285

Yes a losing trade time to learn
http://kreslik.com/forums/viewtopic.php?p=36207#36207

Which methods are popular?
http://kreslik.com/forums/viewtopic.php?p=36032#36032

MY DARKESS TIME
http://kreslik.com/forums/viewtopic.php?p=36043#36043

RAT TRADING
http://kreslik.com/forums/viewtopic.php?p=35956#35956

OMG I GOT IT!!
http://kreslik.com/forums/viewtopic.php?p=36135#36135

many thanks
BB

What i learnt about Fib Retracements today

Posted: Sat Mar 20, 2010 11:55 am
by bettlebox
Words from The Master (TRO)

Quote from TRO:- "You can usually get a 23% retrace off of support/resistance.

If the drop/run up is big and happens fast, you usually see a 50% retrace.

These targets come in handy. You can close half your position, lock in profit, and let the rest ride."


Hi

in 1-2-3 pattern i can use 23% retrace rule as first target and have afading position to squeeze as many pips out a trade as possible. I think looking at hourly chart looking for S/R area . Bring the retracement in to aid possible take profit zones.


BB.

Learning Zlines with Bettlebox

Posted: Sun Mar 21, 2010 2:58 pm
by bettlebox
Hi everyone this start new topic for " Zlines"

I have read NLA about this topic here my first steps. I working through the http://kreslik.com/forums/viewtopic.php ... start=2440 topic step by step and documenting some my thoughts etc.

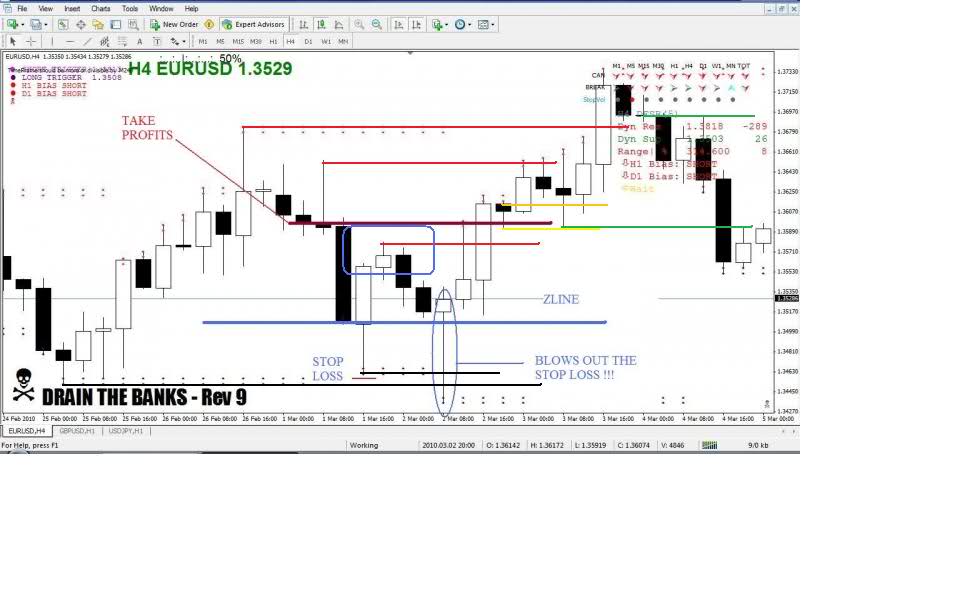
On attached chart i have circled and drawn lines area i want to talk about 1,2,3,4 and ABC and black circle

So at first circle label 1 in picture we can see quite clearly the price made a high and retraced. There was some selling and this stalled. At circle 2 we see very slow momentum , bodys of candles are showing the direction of price and long shadows . I can see why you have take profit here. Then we have burst of momentum from 2 to 3. Were price stalls again and again some selling but nothing major.

Now with my basic knowledge so far i would all so consider this a take profit area? not sure why he picked lower take profit area over this 1.Maybe someone like mightone can answer my question.

anyway prices bursts out from 3 to 4 but this time it wasnt as strong as play from 2 to 3. I wonder is this market slowing down :D. Notice around and just few candles beyond 4 there long shadows appearing.

Is the market exploring the possbililty of reversals or Big boys fooling novice into thinking that?

anyway price has finial push to high and stalls again.

But whats different from this stall to all other stalls inprice ie 1,2,3,4?

Ok im jsut going say i see for moment it might help me?
at the line labelled A. what do i see? i see a red candle ie close lower than open. Ok so what.
I also noted its closed 50% into last 4 hours consildated in to one bar. This is interest.

moving on to bar labelled B what do i see? again its red bar with little less momentum from A.
But is not closed in lower 1/3 of the pervious 4 hour conslidated bar.

looking at other stall areas 1,2,3,4 the price never retraced that far. That only thing i see differently.ok this could be clue. noted and logged lets go on,

umm interesting bar labelled C is small green barm close higher than open, what else do i see?
its close at 50% into bar labelled B. ok so what.

bar labelled D is interesting it gapped up pushed price up but stalled ended up closing as red candle into 50% on bar labelled C. So market though price was going to going up and do another breakout but it failed.

ok moving on to black circle what do i see red and green candles of course but i also see price attempting to contining going up and then been slapped back down at rougly the same price level.I see top wicks and see strong momentum moves to downside. moving out i see the price level were the price is stalling in the black circle is roughly in lower third of the consildated 4 hour candles that formed previous high

So some big differences in price actions from 1,2,3,4 and ABCD and blacks circle. Can i draw an conclusions no sorry its too early in learning step for me do that.

any comment or advice would be greatly appreicated
BB

addition thought the price retracements in 1,2,3,4 stay in top 1/3 or top half of the major momtentum moves. just observations.

Bettleboxs first attempt at Zline

Posted: Sun Mar 21, 2010 5:40 pm
by bettlebox
Hi

right this my first attempt at drawing Zlines. It done on hindsight i know it will different do it on live chart. Anyway here it goes.

Why did i pick these lines? well take Zline first. The EU was coming off a downtread and retraced but if have read my pervious post about zlines , see something interesting how price forms retraces 50% into previous hourly candle. So i draw my ZLine at close of last body of last ie circled area 2.

What about my Take profit line i just look to last area that stalled and marked the body of lowest point on 5 mins scale. Circled area 1.

BB

Posted: Sun Mar 21, 2010 5:55 pm
by bettlebox
Hi,

heres a play at 4 hour time frame blows out stop loss. That be big loss.
i sure havent grasped something important about these zlines.

any comments please on how you of if you would played this?

BB


Re: Bettleboxs first attempt at Zline

Posted: Sun Mar 21, 2010 6:04 pm
by tmanbone
bettlebox wrote:Hi

right this my first attempt at drawing Zlines. It done on hindsight i know it will different do it on live chart. Anyway here it goes.

Why did i pick these lines? well take Zline first. The EU was coming off a downtread and retraced but if have read my pervious post about zlines , see something interesting how price forms retraces 50% into previous hourly candle. So i draw my ZLine at close of last body of last ie circled area 2.

What about my Take profit line i just look to last area that stalled and marked the body of lowest point on 5 mins scale. Circled area 1.

BB


Target looks good, however I would have drawn my zline somewhere in the bottom 50% of the 11th candle from the right, being it is the first momo up from the swing low.

Posted: Sun Mar 21, 2010 6:11 pm
by tmanbone
bettlebox wrote:Hi,

heres a play at 4 hour time frame blows out stop loss. That be big loss.
i sure havent grasped something important about these zlines.

any comments please on how you of if you would played this?

BB


The bottom 50% of the 15th candle from the right, is the mighty zone, the first momo candle up from the swing low, pull your zline up into the area that makes sense to you, some folks put it at the bottom of that candle, some folks at the close of the previous candle, some folks at the high of the previous candle, target the highs to the left. Remember the momo candle has to at least be twice as large as the previous candle to be valid. Study price action @ support and resistance, also learn to spot a hammer and shooting star candle in your sleep. The candle you have circled is a text book hammer, commonly found at the bottom of a swing low. Momo after a hammer/shooting star = A+. Study es/pip he has it down to a science. On a closing thought, be prepared for it is a journey, the sharpest traders are still learning after decades of trading.

Posted: Sun Mar 21, 2010 6:50 pm
by es/pip
bettlebox wrote:Hi,

heres a play at 4 hour time frame blows out stop loss. That be big loss.
i sure havent grasped something important about these zlines.

any comments please on how you of if you would played this?

BB


when you post a chart for zl/mz or s/r extremes--- and looking for comments----- just use a blank chart with nothing else on it---- easier to see whats going on that way


when you say "Blows out stop loss"

are you saying you would have been long in that? no reason to be long yet from where you are looking at

hindsight---- but this is what i would have been thinking

big black bar moves down creates MZ =blue rectangle. would be looking for short in that area and targeting extreme on the first black line

then

would be looking at that extreme and the other one marked in black--- playing long and targeting first red line----- may have gone short off that extreme and taken a small loss

then i would take longs off the yellow lines and targeting the high upper red line

looking for shorts off the upper green line and looking for the extreme -- lower green line

Image

Posted: Sun Mar 21, 2010 7:55 pm
by bettlebox
Thanks you Tmanbone and es/pip.

took me couple passes and slowly reading through your responses.But i actually understand and see how you arrived at these trades. Just need to let the old brain cells chew this information over.

NB:
Ill make sure any future charts are clean and larger.

thank you guys your comments are like gold.
BB.

Posted: Sun Mar 21, 2010 11:06 pm
by tmanbone
Ill make sure any future charts are clean and larger.

Yes clean charts, and the chart itself without the top and bottom headers, as you posted in your 3rd post will help. Do not only read the info that folks are trying to teach you, but understand what you have read, this will get you to the 5% club, therefore putting you ahead of the 95%, the ultimate goal here. Ask your questions in bit size chunks, they'll be more likely to be answered. Remember to FOCUS, as TRO says to the newcomer, 1 pair, 1 method until mastered, then and only then you can start adding to your arsenal. I suggest you post in each of your threads a link to your new home, to let folks know that this is your learning center now.