Page 1 of 35

Daily analysis from FXOpen

Posted: Tue Aug 23, 2022 12:47 pm
by whiteking
Dear mods.

I will post daily market analysis FXOpen here. If allows I will trying to update, but if disallowed, please delete this thread.

Thank you

Re: Daily analysis from FXOpen

Posted: Wed Aug 24, 2022 1:15 pm
by whiteking
EUR/USD Nosedives, USD/JPY Aims More Upsides

Image

EUR/USD started another decline from the 1.0200 resistance. USD/JPY is rising and might gain pace above the 138.00 resistance zone.

Important Takeaways for EUR/USD and USD/JPY
  • The Euro started a fresh decline and even traded below the 1.0000 support.
  • There was a break above a key bearish trend line with resistance near 0.9955 on the hourly chart of EUR/USD.
  • USD/JPY started a fresh increase after it broke the 133.50 resistance zone.
  • There was a break above a major bearish trend line with resistance near 134.00 on the hourly chart.

EUR/USD Technical Analysis

This past week, the Euro started a fresh decline from well above the 1.0180 level against the US Dollar. The EUR/USD pair declined below the 1.0150 and 1.0120 support levels.

The bears even pushed the pair below the 1.0050 level. There was a close below 1.0000 and the 50 hourly simple moving average. The pair traded as low as 0.9898 and recently started a minor upside correction.

Image

EUR/USD Hourly Chart

There was a move above the 23.6% Fib retracement level of the downward move from the 1.0203 swing high to 0.9898 low. Besides, there was a break above a key bearish trend line with resistance near 0.9955 on the hourly chart of EUR/USD.

However, the pair struggled to clear the 1.0000 resistance zone and the 50 hourly simple moving average. An immediate resistance on the upside is near the 0.9970 level.

The next major resistance is near the 1.0000 level. An upside break above 1.0000 could set the pace for a steady increase. In the stated case, the pair might revisit 1.0050. It is near the 50% Fib retracement level of the downward move from the 1.0203 swing high to 0.9898 low.

If not, the pair might drop and test the 0.9920 support. The next major support is near 0.9900, below which the pair could drop to 0.9850 in the near term.

Re: Daily analysis from FXOpen

Posted: Thu Aug 25, 2022 2:35 pm
by whiteking
ETHUSD and LTCUSD Technical Analysis – 25th AUG, 2022

Image

ETHUSD: Bullish Harami Pattern Above $1523

Ethereum was unable to sustain its bearish momentum and after touching a low of 1529 on 20th Aug started to correct upwards, crossing the $1700 handle in the European trading session today.

We can see a continuous appreciation in the prices of Ethereum due to the buying seen at lower levels by the medium-term investors.

We can clearly see a bullish harami pattern above the $1523 handle which is a bullish pattern and signifies the end of a bearish phase and the start of a bullish phase in the markets.

ETH is now trading just below its pivot level of 1709 and moving into a strongly bullish channel. The price of ETHUSD is now testing its classic resistance level of 1713 and Fibonacci resistance level of 1718 after which the path towards 1800 will get cleared.

The relative strength index is at 63 indicating a STRONG demand for Ether and the continuation of the uptrend in the markets.

We can see that the adaptive moving average, AMA100, is indicating a bullish trend reversal in both the 2-hour and 4-hour timeframes.

The Williams percent range is indicating an OVERBOUGHT market, which means that the prices are expected to correct downwards in the short-term range.

Most of the technical indicators are giving a STRONG BUY market signal.

All of the moving averages are giving a STRONG BUY signal and we are now looking at the levels of $1800 to $1900 in the short-term range.

ETH is now trading Above its 100 hourly simple and exponential moving averages.
  • Ether: bullish reversal seen above the $1523 mark
  • Short-term range appears to be strongly BULLISH
  • ETH continues to remain above the $1600 level
  • The average true range is indicating LESS market volatility

Ether: Bullish Reversal Seen Above $1523

Image

ETHUSD is now moving into a strong bullish channel with the prices trading above the $1600 handle in the European trading session today.

ETH touched an intraday low of 1652 in the Asian trading session and an intraday high of 1715 in the European trading session today.

We have seen a bullish opening with a gap in the markets which indicates that now we are heading towards the $1800 mark.

The daily RSI is printing at 50 indicating a neutral demand in the long-term range.

Ethereum continues to move in a rising trend channel which is expected to continue in the medium-term range.

The key support levels to watch are $1600 and $1660, and the price of ETHUSD need to remain above these levels for the continuation of the bullish reversal in the markets.

ETH has increased by 3.91% with a price change of 64$ in the past 24hrs and has a trading volume of 16.144 billion USD.

We can see a decrease of 10.39% in the total trading volume in the last 24 hrs which appears to be normal.

The Week Ahead

We can see a continuous progression of a bullish trendline formation from 1523 towards the 1762 levels.

The price of Ethereum is now testing its resistance zone located at $1800 and we are likely to witness a rally in the price once it touches these levels.

The immediate short-term outlook for Ether has turned strongly BULLISH, the medium-term outlook has turned NEUTRAL, and the long-term outlook for Ether is NEUTRAL in present market conditions.

The prices of ETHUSD will need to remain above the important support level of $1600 this week.

The weekly outlook is projected at $1950 with a consolidation zone of $1800.

Technical Indicators:

The relative strength index (14): at 62.26 indicating a BUY

The moving averages convergence divergence (12,26): at 15.03 indicating a BUY

The rate of price change: at 1.03 indicating a BUY

The ultimate oscillator: at 60.70 indicating a BUY

Re: Daily analysis from FXOpen

Posted: Mon Aug 29, 2022 6:38 am
by whiteking
GBP/USD Nosedives While USD/CAD Gains Strength

Image

GBP/USD accelerated lower below the 1.1850 and 1.1750 support levels. USD/CAD is surging and could continue to rise above the 1.3075 resistance zone.

Important Takeaways for GBP/USD and USD/CAD
  • The British Pound started a major decline below the 1.1850 support zone.
  • There is a key bearish trend line forming with resistance near 1.1830 on the hourly chart of GBP/USD.
  • USD/CAD started a fresh increase above the 1.3000 resistance zone.
  • There was a break above a major bearish trend line with resistance near the 1.2970 on the hourly chart.

GBP/USD Technical Analysis

After a strong rejection near 1.2000, the British Pound started a fresh decline against the US Dollar. GBP/USD declined heavily below the 1.1920 support zone.

There was a move below the 1.1850 support zone and the 50 hourly simple moving average. The pair even traded below the 1.1750 support zone and formed a low near 1.1655. It is now consolidating losses above the 1.1650 level.

Image

GBP/USD Hourly Chart

An immediate resistance is near the 1.1710 level. It is near the 23.6% Fib retracement level of the downward move from the 1.1900 swing high to 1.1655 low.

The next key resistance is near the 1.1780 level. It is near the 50% Fib retracement level of the downward move from the 1.1900 swing high to 1.1655 low. The main resistance is now forming near the 1.1820 zone.

Besides, there is a key bearish trend line forming with resistance near 1.1830 on the hourly chart of GBP/USD. If there is an upside break above the 1.1820 zone, the pair could rise towards 1.1900. The next key resistance could be 1.1950, above which the pair could gain strength.

On the downside, an initial support is near the 1.1650 area. The first major support is near the 1.1620 level. If there is a break below 1.1620, the pair could extend its decline. The next key support is near the 1.1550 level. Any more losses might call for a test of the 1.1500 support.

Re: Daily analysis from FXOpen

Posted: Tue Aug 30, 2022 1:22 pm
by whiteking
#MarketNews #China

PEOPLE'S BANK OF CHINA READY TO SUPPORT THE WEAK YUAN

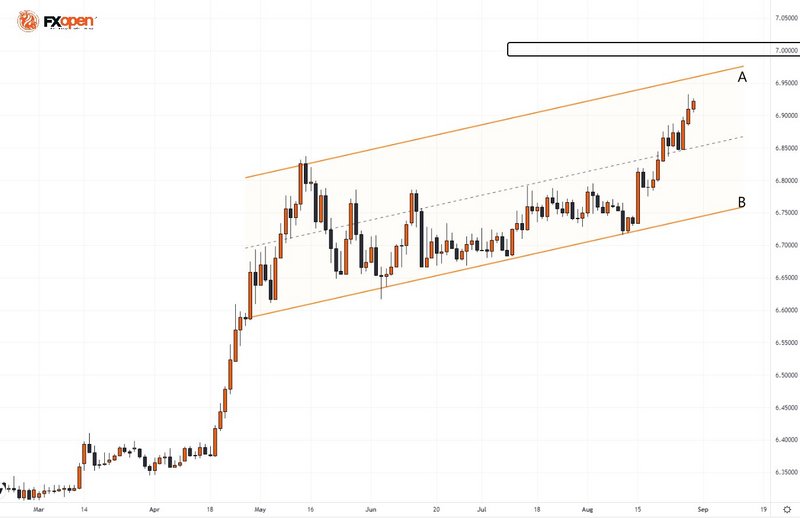
Over the past six months, the yuan has weakened by about 10%. In early March, USDCNH was trading around 6.31, and in late August it was around 6.92.

Reasons for the sharp depreciation of the yuan are as follows:
  • the Fed's tough policy aimed at fighting inflation and strengthening the dollar
  • disappointing economic data from China linked to the mortgage crisis and the slowdown in industrial production.
  • geopolitical tensions between the US and China.

The USDCNH rate rises to the psychological mark of 7.0. Bloomberg writes that the PBoC is taking active steps to prevent further weakening of the yuan. In previous years, the PBoC intervened at this level.

The chart shows that the rate is getting closer to the upper border of the AB channel — the line from which we can expect that it will provide resistance. It can be a guideline for the entry point to the short position based on the activity of the PBoC.

Image

CFDs are complex instruments and come with a high risk of losing your money.

This forecast represents FXOpen Companies opinion only, it should not be construed as an offer, invitation or recommendation in respect to FXOpen Companies products and services or as financial advice.


Source: FXOpen Telegram channel

Re: Daily analysis from FXOpen

Posted: Wed Aug 31, 2022 5:22 am
by whiteking
EUR/USD and USD/CHF Eye Steady Increase

Image

EUR/USD is struggling to clear the 1.0050 resistance zone. USD/CHF is rising and might climb higher towards the 0.9800 resistance zone.

Important Takeaways for EUR/USD and USD/CHF
  • The Euro is facing a strong resistance near the 1.0050 zone against the US Dollar.
  • There is a key bearish trend line forming with resistance near 1.0035 on the hourly chart of EUR/USD.
  • USD/CHF started a fresh increase after it cleared the 0.9680 resistance zone.
  • There was a break above a key contracting triangle with resistance near 0.9682 on the hourly chart.

EUR/USD Technical Analysis

This past week, the Euro saw a major decline below the 1.0000 support against the US Dollar. The EUR/USD pair declined below the 0.9950 support level before the bulls appeared.

The pair formed a base above the 0.9900 level and recently started an upside correction. There was a move above the 0.9920 and 0.9950 resistance levels. The pair climbed above the 1.0000 level and the 50 hourly simple moving average.

Image

EUR/USD Hourly Chart

The pair traded above the 50% Fib retracement level of the downward move from the 1.0089 swing high to 0.9914 low. It is now consolidating above the 1.0020 level.

An immediate resistance is near the 1.0040 level. There is also a key bearish trend line forming with resistance near 1.0035 on the hourly chart of EUR/USD. The next major resistance is near the 1.0050 level. It is near the 76.4% Fib retracement level of the downward move from the 1.0089 swing high to 0.9914 low.

A clear move above the 1.0050 resistance zone could set the pace for a larger increase towards 1.0100. The next major resistance is near the 1.0150 zone.

On the downside, an immediate support is near the 1.0000 level. The next major support is near the 0.9950 level. A downside break below the 0.9950 support could start another decline.

Source: FXOpen blog

Disclaimer: CFDs are complex instruments and come with a high risk of losing your money.

Re: Daily analysis from FXOpen

Posted: Thu Sep 01, 2022 2:53 pm
by whiteking
ETHUSD and LTCUSD Technical Analysis – 01st SEP, 2022

Image

ETHUSD: Bearish Engulfing Pattern Below $1721

Ethereum was unable to sustain its bullish momentum and after touching a high of 1721 on 25th Aug started to decline against the US dollar, coming down below the $1500 handle on 29th Aug.

We can see heavy selling pressure in Ethereum because of which it continued its decline touching a low of $1424.

We can clearly see a bearish engulfing pattern below the $1721 handle which is a bearish pattern and signifies the end of a bullish phase and the start of a bearish phase in the markets.

ETH is now trading just above its pivot level of 1541 and is moving into a strong bearish channel. The price of ETHUSD is now testing its classic support level of 1522 and Fibonacci support level of 1536 after which the path towards 1500 will get cleared.

The relative strength index is at 40 indicating a WEAK demand for Ether and the continuation of the downtrend in the markets.

We can see the adaptive moving average bearish crossover pattern in AMA20 and AMA50 indicating a bearish trend reversal in the 30-minutes time frame.

Both the STOCHRSI and Williams percent range are indicating an OVERSOLD market, which means that the prices are expected to correct upwards in the short-term range.

Most of the technical indicators are giving a STRONG SELL market signal.

Most of the moving averages are giving a STRONG SELL signal and we are now looking at the levels of $1450 to $1500 in the short-term range.

ETH is now trading above both its 200 hourly simple and exponential moving averages.
  • Ether: bearish reversal seen below the $1721 mark
  • The short-term range appears to be strongly BEARISH
  • ETH continues to remain below the $1600 level
  • The average true range is indicating LESS market volatility
Ether: Bearish Reversal Seen Below $1721
Image

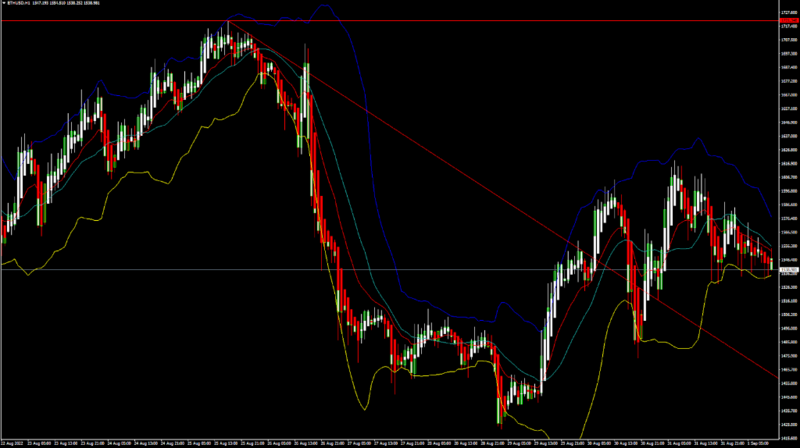
ETHUSD is now moving into a strong bearish channel with the price trading below the $1600 handle in the European trading session today.

ETH touched an intraday low of 1534 and an intraday high of 1583 in the Asian trading session today. The movements remain range-bound between the $1500 and $1600 levels.

The MACD has crossed down its moving average in the 4-hour time frame indicating the underlying bearish nature of the markets.

We can see the formation of a bearish harami pattern in the 30-minute time frame which indicates that now we are heading towards the $1500 mark.

The daily RSI is printing at 45 indicating a neutral demand in the long-term range.

Ethereum continues to move into a falling trend channel which is expected to continue in the short-term range.

The key support levels to watch are $1400 and $1420 and the prices of ETHUSD need to remain above these levels for any potential bullish reversal in the markets.

ETH has decreased by 1.56% with a price change of 24$ in the past 24hrs and has a trading volume of 17.680 billion USD.

We can see a decrease of 24.09% in the total trading volume in the last 24 hrs which appears to be normal.

The Week Ahead

We can see a continuous progression of a bearish trendline formation from 1721 towards the 1459 level.

The price of Ethereum is now testing its support zone located at $1400 and we are likely to witness a rally in the prices once it touches these levels.

The immediate short-term outlook for Ether has turned strongly BEARISH, the medium-term outlook has turned NEUTRAL, and the long-term outlook for Ether is NEUTRAL in present market conditions.

The prices of ETHUSD will need to remain above the important support level of $1400 this week.

The weekly outlook is projected at $1500 with a consolidation zone of $1400.

Technical Indicators:

The relative strength index (14): at 40.90 indicating a SELL

The moving averages convergence divergence (12,26): at -5.39 indicating a SELL

The rate of price change: at -2.28 indicating a SELL

The ultimate oscillator: at 47.37 indicating a SELL

Disclaimer: CFDs are complex instruments and come with a high risk of losing your money.

Re: Daily analysis from FXOpen

Posted: Fri Sep 02, 2022 6:43 am
by whiteking
Gold Price Dives While Crude Oil Price Keeps Struggling

Image

Gold price started a fresh decline below the $1,720 support zone. Crude oil price is also struggling and remains at a risk of more losses.

Important Takeaways for Gold and Oil
  • Gold price started a fresh decline after it failed to stay above $1,735 against the US Dollar.
  • There is a key bearish trend line forming with resistance near $1,705 on the hourly chart of gold.
  • Crude oil price also started a steady decline from the $97.25 zone.
  • There was a break below a couple of bullish trend lines with support near $94.80 and $91.90 on the hourly chart of XTI/USD.

Gold Price Technical Analysis

Gold price attempted to gain pace above the $1,760 level against the US Dollar. However, the price failed to stay above $1,750 and started a fresh decline.

There was a clear move below the $1,735 support zone and the 50 hourly simple moving average. The price declined below the $1,720 level to move into a short-term bearish zone. The decline gained pace below the $1,700 level.

Image

Gold Price Hourly Chart

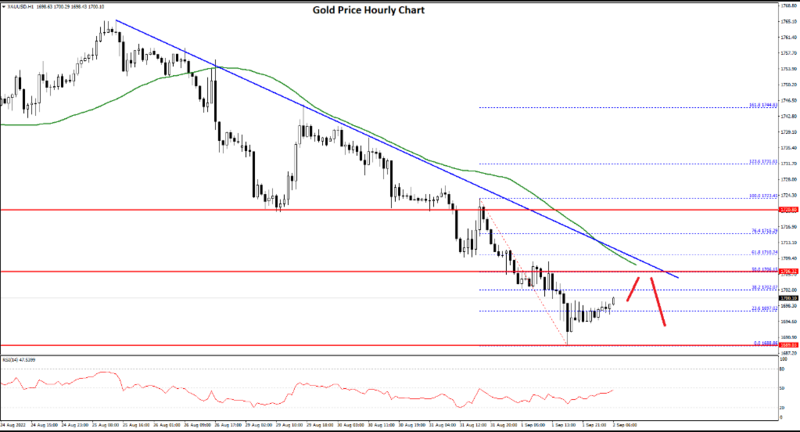
The price traded as low as $1,688 and is currently consolidating losses. On the upside, the price is facing resistance near the $1,700 level. It is near the 38.2% Fib retracement level of the recent decline from the $1,723 swing high to $1,688 low.

The main resistance is now forming near the $1,705 level. There is also a key bearish trend line forming with resistance near $1,705 on the hourly chart of gold.

The trend line is near the 50% Fib retracement level of the recent decline from the $1,723 swing high to $1,688 low. A close above the $1,705 level could open the doors for a steady increase towards $1,720. A clear upside break above the $1,720 resistance could send the price towards $1,735.

An immediate support on the downside is near the $1,692 level. The next major support is near the $1,688 level, below which there is a risk of a larger decline. In the stated case, the price could decline sharply towards the $1,665 support zone.


Disclaimer: CFDs are complex instruments and come with a high risk of losing your money.

Re: Daily analysis from FXOpen

Posted: Mon Sep 05, 2022 5:43 am
by whiteking
GBP/USD and GBP/JPY Could Extend Losses

Image

GBP/USD started a major decline and traded below 1.1500. GBP/JPY is consolidating above the 160.80 support, with a bearish angle.

Important Takeaways for GBP/USD and GBP/JPY
  • The British Pound started a major decline below the 1.1620 support against the US Dollar.
  • There is a major bearish trend line forming with resistance near 1.1520 on the hourly chart of GBP/USD.
  • GBP/JPY declined steadily after it failed to clear the 162.50 resistance zone.
  • There was a break below a key bullish trend line with support near 161.15 on the hourly chart.
GBP/USD Technical Analysis

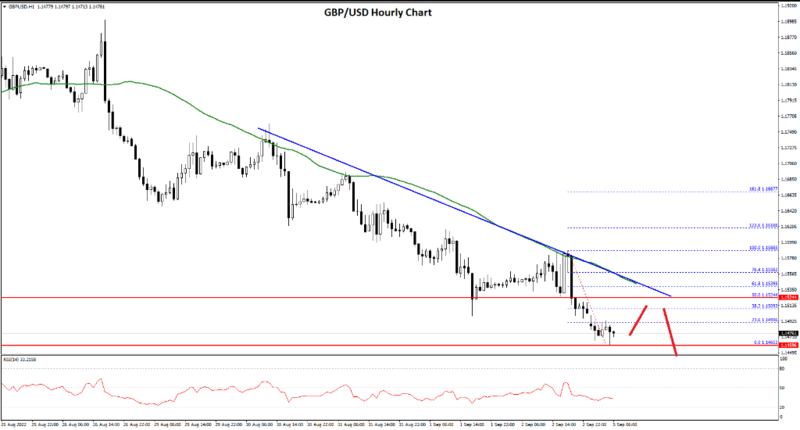
This past week, the British Pound started a major decline from the 1.1880 zone against the US Dollar. The GBP/USD pair declined below the 1.1800 support to move into a bearish zone.

There was a steady decline below the 1.1700 level and the 50 hourly simple moving average. The pair even traded below the 1.1620 support zone. The pair traded as low as 1.1460 on FXOpen and is currently consolidating losses.

Image

GBP/USD Hourly Chart

An immediate resistance on the upside is near the 1.1510 level. It is near the 38.2% Fib retracement level of the recent decline from the 1.1588 swing high to 1.1460 level.

The next major resistance is near the 1.1520 level and the 50 hourly simple moving average. There is also a major bearish trend line forming with resistance near 1.1520 on the hourly chart of GBP/USD. The trend line is near the 50% Fib retracement level of the recent decline from the 1.1588 swing high to 1.1460 level.

An upside break above 1.1520 might start a fresh increase towards 1.1550. Any more gains might call for a move towards 1.1585 or even 1.1620. An immediate support is near the 1.1460. The next major support is near the 1.1400 level.

If there is a break below the 1.1400 support, the pair could test the 1.1350 support. Any more losses might send GBP/USD towards 1.1300.

Disclaimer: CFDs are complex instruments and come with a high risk of losing your money.

Re: Daily analysis from FXOpen

Posted: Tue Sep 06, 2022 2:39 pm
by whiteking
OPEC+ DECIDED TO CUT OIL PRODUCTION. WHAT'S NEXT?

In mid-July 2022, Biden visited Saudi Arabia. At the time, the media said that the US president persuaded oil producers to increase production — this was supposed to reduce the price of oil and reduce the rate of inflation.

However, at yesterday's meeting of the country, OPEC + members decided to reduce oil production (by 100,000 barrels per day), since after its price fell (by almost 30% from June highs), it became not so profitable to produce and sell oil.

The media are reporting on the deterioration of relations between the United States and Saudi Arabia.

At first glance, the situation looks strong, because:

-->>the fundamentals are strong. Oil producers are ready to fight for expensive oil. The next OPEC+ meeting is scheduled for October;
-->>technically, the price is forming a rebound from the long-term trend line (1).

However, after the sharp decline on August 30 - September 1 (2), there is an increased chance that the rebound will be weak. This will then confirm that the bears have not lost their advantage in the market, which is likely to upset the oil producers and create prerequisites for a bearish breakdown of the long-term channel.

Image

Disclaimer: CFDs are complex instruments and come with a high risk of losing your money.