TRO DYNAMIC SR 2CAN
Posted: Thu May 17, 2007 4:51 pm
TRO DYNAMIC SR 2CAN
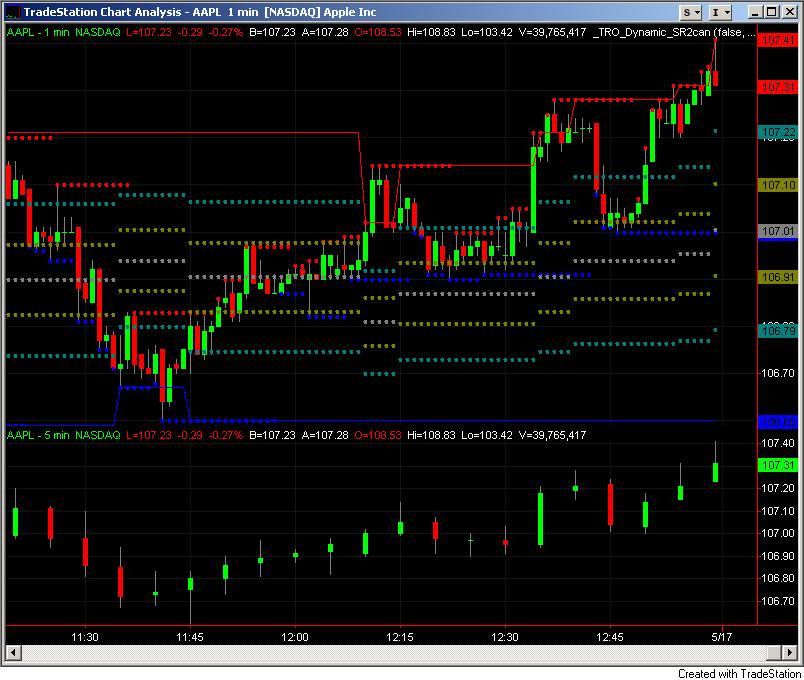
TRO DYNAMIC SR 2CAN plots dynamic support/resistance for 2 different intervals on the same chart.
The fib dots are plotted for data 2.
In the example, data 1 is a 1 min and data 2 is 5 min.
Data 1 support/resistance are the blue/red dots.
Data 2 support/resistance are the blue/red lines.
ELD attached.
NOTE MAY 21, 2007 ATTACHED WORKSPACE.