GBP/USD started a downside correction from the 1.2445 resistance. GBP/JPY declined and remains at a risk of more losses below the 165.25 zone.
Important Takeaways for GBP/USD and GBP/JPY
- The British Pound struggled to clear the 1.2445 resistance zone against the US Dollar.
- There was a break below a key bullish trend line with support near 1.2320 on the hourly chart of GBP/USD.
- GBP/JPY started a fresh decline from the 168.80 resistance zone.
- There was a break below a major bullish trend line with support near 167.20 on the hourly chart.
This past week, the British Pound found support near the 1.2150 zone against the US Dollar. The GBP/USD pair formed a base and started a steady recovery wave above the 1.2320 level.
There was a clear move above the 1.2400 resistance and the 50 hourly simple moving average. However, the pair struggled to clear the 1.2445 resistance zone. A high was formed near 1.2446 on FXOpen and the pair started a downside correction.
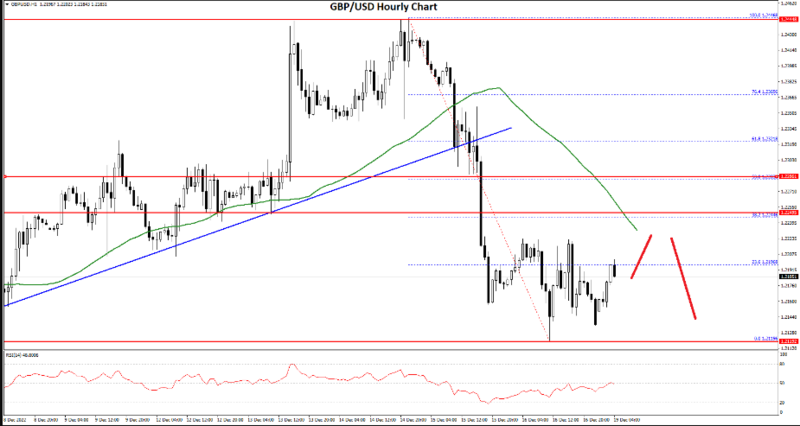
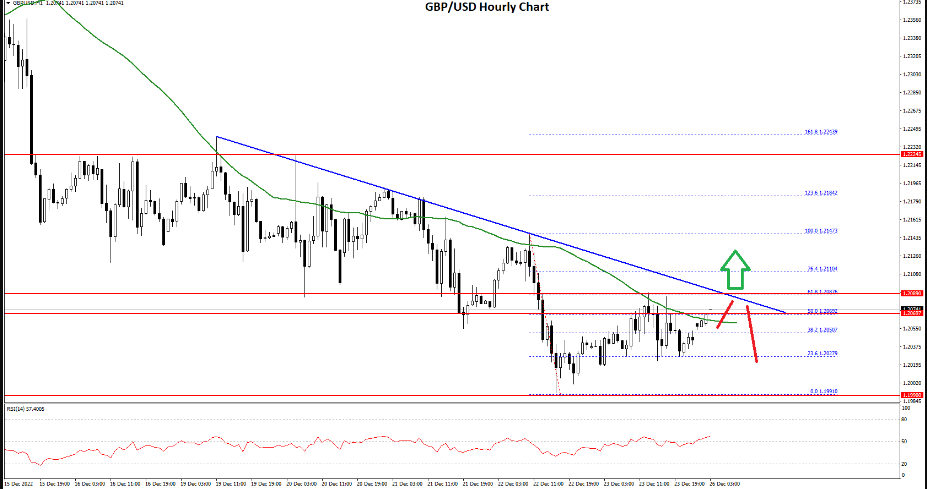
GBP/USD Hourly Chart
There was a move below the 1.2350 support and the 50 hourly simple moving average. Besides, there was a break below a key bullish trend line with support near 1.2320 on the hourly chart of GBP/USD.
The pair traded as low as 1.2119 and recently corrected losses. It tested the 23.6% Fib retracement level of the downward move from the 1.2446 swing high to 1.2119 low. An immediate resistance on the upside is near the 1.2240 level.
The next major resistance is near the 1.2265 level or the 50% Fib retracement level of the downward move from the 1.2446 swing high to 1.2119 low, above which the pair could start a steady increase towards 1.2320.
An upside break above 1.2320 might start a fresh increase towards 1.2400. Any more gains might call for a move towards 1.2445 or even 1.2500.
An immediate support is near the 1.2150. The next major support is near the 1.2120 level. If there is a break below the 1.2120 support, the pair could test the 1.2050 support. Any more losses might send GBP/USD towards 1.2000.
Disclaimer: CFDs are complex instruments and come with a high risk of losing your money.