Daily analysis from FXOpen

forex live trades, setups, charts

Moderator: moderators

User avatar
whiteking
rank: 150+ posts
rank: 150+ posts
Posts: 350
Joined: Fri Aug 11, 2017 2:25 am
Reputation: 32
Gender: None specified

Re: Daily analysis from FXOpen

Postby whiteking » Fri Dec 02, 2022 6:17 am

Gold Price and Crude Oil Price Aim More Upsides, Bulls In Control

Image

Gold price climbed higher and traded above the $1,780 resistance. Crude oil price is also rising and might climb further higher above $82.50.

Important Takeaways for Gold and Oil
  • Gold price found support near the $1,720 level and started a fresh increase against the US Dollar.
  • There is a key bullish trend line forming with support near $1,792 on the hourly chart of gold.
  • Crude oil price gained bullish momentum above the $80.00 resistance zone.
  • There is a major bullish trend line forming with support near $81.00 on the hourly chart of XTI/USD.
Gold Price Technical Analysis

Gold price formed a base above the $1,720 level against the US Dollar. The price started a fresh increase and was able to clear the $1,750 and $1,765 resistance levels.

There was a clear move above the $1,780 resistance and the 50 hourly simple moving average. The price even broke the $1,800 level and traded as high as $1,804 on FXOpen. Recently, there was a downside correction below the $1,800 level.

Image

Gold Price Hourly Chart

An immediate support on the downside is near the $1,792 level. There is also a key bullish trend line forming with support near $1,792 on the hourly chart of gold.

The trend line is close to the 23.6% Fib retracement level of the upward move from the $1,745 swing low to $1,804 high. The next major support is near the $1,775 level or the 50 hourly simple moving average.

The 50% Fib retracement level of the upward move from the $1,745 swing low to $1,804 high is also near $1,775, below which there is a risk of a larger decline.

In the stated case, the price could decline sharply towards the $1,750 support zone. On the upside, the first major resistance is near the $1,800 level.

The main resistance is now forming near the $1,805 level, above which it could even test $1,820. A clear upside break above the $1,820 resistance could send the price towards $1,840.

Disclaimer: CFDs are complex instruments and come with a high risk of losing your money.
I trade at FXOpen

Please add www.kreslik.com to your ad blocker white list.
Thank you for your support.

User avatar
whiteking
rank: 150+ posts
rank: 150+ posts
Posts: 350
Joined: Fri Aug 11, 2017 2:25 am
Reputation: 32
Gender: None specified

Re: Daily analysis from FXOpen

Postby whiteking » Tue Dec 06, 2022 4:02 pm

BTCUSD and XRPUSD Technical Analysis – 06th DEC 2022

Image

BTCUSD: Inverted Hammer Pattern Above $16009

Bitcoin was unable to sustain its bearish momentum and after touching a low of 16009 on 28th Nov, the prices started to correct upwards against the US dollar crossing the $17000 handle on 06th Dec.

We have seen a continued escalation in the prices of bitcoin due to the increasing global demands and buying at lower levels.

The resistance of the channel is broken in the 15-minute time frame indicating bullish trends.

We can see a bullish trend reversal pattern with the adaptive moving averages, AMA5, in the 15-minute time frame, and AMA20 in the 30-minute time frame.

We can clearly see an inverted hammer pattern above the $16009 handle which is a bullish reversal pattern because it signifies the end of a downtrend and a shift towards an uptrend.

Bitcoin touched an Intraday low of 16924 and an intraday high of 17098 in the Asian trading session today.

Both the STOCH and STOCHRSI are indicating overbought levels which means that in the immediate short term, a decline in the prices is expected.

The relative strength index is at 50 indicating a NEUTRAL demand for bitcoin, and the shift towards the consolidation channel in the markets.

Bitcoin is now moving below its 100 hourly simple moving average and its 200 hourly exponential moving averages.

Most of the major technical indicators are giving a STRONG BUY signal, which means that in the immediate short term, we are expecting targets of 18000 and 18500.

The average true range is indicating LESS market volatility with a mildly bullish momentum.
  • Bitcoin: bullish reversal seen above $16009
  • The Williams percent range is indicating an overbought level
  • The price is now trading just below its pivot level of $17093
  • Some of the moving averages are giving a BUY market signal

Bitcoin: Bullish Reversal Seen Above $16009

Image

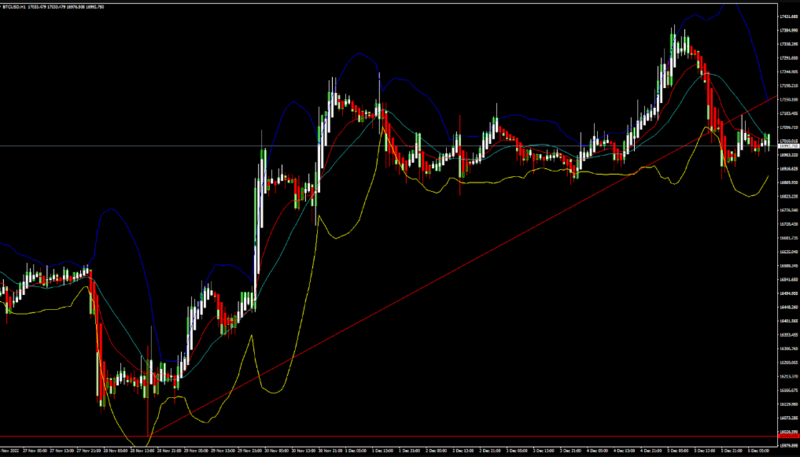
We can now see that the price of bitcoin is moving in a mildly bullish momentum and we are expecting moves towards the consolidation phase before any upwards rebound this week.

The RSI indicator is back over 50 indicating a bullish scenario in the daily time frame.

The ichimoku – bullish crossover: tenkan & kijun pattern is seen in the daily time frame indicating bullish trends.

We can see the formation of an inverted hammer / white gravestone pattern in the weekly time frame.

The price of bitcoin has crossed the $17000 handle today ranging near to a three-week High.

The immediate short-term outlook for bitcoin is mildly bullish, the medium-term outlook has turned bullish, and the long-term outlook remains neutral under present market conditions.

Bitcoin’s support zone is located at $16716 at which the price crosses the 9-day moving average.

The price of BTCUSD is now facing its classic resistance level of 17300 and Fibonacci resistance level of 17627 after which the path towards 18000 will get cleared.

In the last 24hrs BTCUSD has decreased by 1.85% by 320$ and has a 24hr trading volume of USD 18.733 billion. We can see a decrease of 12.48% in the trading volume compared to yesterday, which appears to be normal.

The Week Ahead

The price of Bitcoin is expected to enter the super bullish zone above the $17000 handle. There is an ascending channel forming with current support at $16395 on the hourly chart of BTCUSD.

We are now preparing to enter the super bullish zone in bitcoin and the prices are expected to gain 100% from the current market levels of $17000 towards $34000 in the starting of next year.

We can see a continuous progression of a bullish trend line formation from $16009 towards the $17169 levels.

The daily RSI is printing at 47 which indicates a NEUTRAL demand for bitcoin and the possibility of a shift towards the consolidation/correction phase for a short term in the markets.

The price of BTCUSD is now facing its resistance zone at $17810 at which the price crosses 18-day moving average stalls.

The weekly outlook is projected at $18500 with a consolidation zone of $18000.

Technical Indicators:

The average directional index, ADX (14): is at 27.55 indicating a BUY

The commodity channel index, CCI (14): is at 84.15 indicating a BUY

The rate of price change, ROC: is at 4.84 indicating a BUY

Bull/bear power (13): is at 410.57 indicating a BUY


Cryptocurrency CFDs are not available to retail clients in the UK

Disclaimer: CFDs are complex instruments and come with a high risk of losing your money.
I trade at FXOpen

User avatar
whiteking
rank: 150+ posts
rank: 150+ posts
Posts: 350
Joined: Fri Aug 11, 2017 2:25 am
Reputation: 32
Gender: None specified

Re: Daily analysis from FXOpen

Postby whiteking » Wed Dec 07, 2022 6:14 am

EUR/USD Corrects Lower While USD/JPY Aims Fresh Increase

Image

EUR/USD gained pace and tested the 1.0600 resistance zone. USD/JPY is rising and might rally if it clears the 137.50 resistance zone.

Important Takeaways for EUR/USD and USD/JPY
  • The Euro started a downside correction from the 1.0600 resistance zone.
  • There is a key bearish trend line forming with resistance near 1.0490 on the hourly chart of EUR/USD.
  • USD/JPY declined sharply after it traded below the 142.00 support zone.
  • There is a major bearish trend line forming with resistance near 137.50 on the hourly chart.
EUR/USD Technical Analysis

This past week, the Euro found support near the 1.0300 zone against the US Dollar. The EUR/USD pair started a steady upward move above the 1.0400 and 1.0450 resistance levels.

There was a steady increase above the 1.0500 resistance zone and the 50 hourly simple moving average. The pair even climbed above the 1.0550 resistance zone. A high was formed near 1.0591 on FXOpen and the pair is now correcting gains.

Image

EUR/USD Hourly Chart

There was a move below the 1.0550 support zone and the 50 hourly simple moving average. The pair traded below the 50% Fib retracement level of the upward move from the 1.0428 swing low to 1.0591 high.

An initial support on the downside is near the 1.0450 level. The first major support is near the 1.04250 level. The main support sits near the 1.0380 zone or the 1.236 Fib extension level of the upward move from the 1.0428 swing low to 1.0591 high, below which the pair could start a major decline.

On the upside, an immediate resistance is near the 1.0490 level. There is also a key bearish trend line forming with resistance near 1.0490 on the hourly chart of EUR/USD.

The next major resistance is near the 1.0520 level. An upside break above 1.0520 could set the pace for another increase. In the stated case, the pair might revisit 1.0580. Any more gains might send the pair towards 1.0650.

Disclaimer: CFDs are complex instruments and come with a high risk of losing your money.
I trade at FXOpen

User avatar
whiteking
rank: 150+ posts
rank: 150+ posts
Posts: 350
Joined: Fri Aug 11, 2017 2:25 am
Reputation: 32
Gender: None specified

Re: Daily analysis from FXOpen

Postby whiteking » Thu Dec 08, 2022 2:48 pm

ETHUSD and LTCUSD Technical Analysis – 08th DEC, 2022

Image

ETHUSD: Double Bottom Pattern Above $1218

Ethereum was unable to sustain its bearish momentum and after touching a low of 1211 on 07th Dec, the price started to correct upwards against the US dollar moving into a consolidation channel above the $1200 handle today in the European trading session.

We can see the formation of a bullish harami pattern in the 15-minute time frame indicating a bullish trend.

The Williams percent range indicator is back over -50 in the 2-hour time frame.

We can clearly see a double bottom pattern above the $1218 handle which is a bullish pattern and signifies the end of a bearish phase and the start of a bullish phase in the markets.

ETH is now trading just below its pivot level of 1232 and moving into a consolidation channel. The price of ETHUSD is now testing its classic resistance level of 1234 and Fibonacci resistance level of 1235 after which the path towards 1300 will get cleared.

The relative strength index is at 53 indicating a NEUTRAL demand for Ether and the continuation of the consolidation phase in the markets.

We can see both the bullish harami and bullish harami cross pattern in the daily time frame.

Both the relative strength index and the average directional index are indicating neutral levels, which means that the prices are expected to remain in a narrow range in the short-term range.

Most of the technical indicators are giving a STRONG BUY market signal.

Most of the moving averages are giving a BUY signal and we are now looking at the levels of $1300 to $1400 in the short-term range.

ETH is now trading below its 100 hourly simple and 200 hourly exponential moving averages.
  • Ether: bullish reversal seen above the $1218 mark
  • The short-term range appears to be mildly bullish
  • ETH continues to remain above the $1200 levels
  • The average true range is indicating LESS market volatility
[m]Ether: Bullish Reversal Seen Above $1218[/b]

ETHUSD is now moving into a mild bullish channel with the price trading above the $1200 handle in the European trading session today.

ETH is now preparing to enter into a consolidation phase above the $1230 handle, after which fresh upside waves are expected.

ETHUSD touched an intraday high of 1234 and an intraday low of 1223 in the Asian trading session today.

We have seen a bullish opening in the markets this week.

The daily RSI is printing at 47 indicating a neutral demand for Ether in the long-term range.

The key support levels to watch are $1191, which is a 14-3 day raw stochastic at 50%, and $1215 at which price crosses 18 Day Moving Average.

ETH has increased by 0.09% with a price change of 1.07$ in the past 24hrs and has a trading volume of 4.698 billion USD.

We can see a decrease of 24.01% in the total trading volume in the last 24 hrs which appears to be Normal.

The Week Ahead

ETH price continues to remain under mild bullish pressure and the prices are expected to remain in a bullish traction this week.

After the current wave of consolidation gets over, we are expecting fresh buying pressure above the $1200 handle which will push the price above the $1300 level.

The immediate short-term outlook for Ether has turned bullish, the medium-term outlook has turned neutral, and the long-term outlook for Ether is neutral in present market conditions.

The price of ETHUSD will need to remain above the important support level of $1199 at which the price crosses 9-day moving average stalls.

The weekly outlook is projected at $1400 with a consolidation zone of $1350.

Technical Indicators:

The relative strength index (14): is at 53.20 indicating a NEUTRAL.

The STOCH (9,6): is at 69.01 indicating a BUY

The MACD (12,26): is at 0.350 indicating a BUY

Bull/bear power (13): is at 1.498 indicating a BUY


Disclaimer: CFDs are complex instruments and come with a high risk of losing your money.
I trade at FXOpen

User avatar
whiteking
rank: 150+ posts
rank: 150+ posts
Posts: 350
Joined: Fri Aug 11, 2017 2:25 am
Reputation: 32
Gender: None specified

Re: Daily analysis from FXOpen

Postby whiteking » Fri Dec 09, 2022 6:05 am

AUD/USD and NZD/USD Eye Steady Increase: Here’s Why

Image

AUD/USD is moving higher and might climb further higher above 0.6800. NZD/USD is also rising and might surge above the 0.6440 resistance zone.

Important Takeaways for AUD/USD and NZD/USD
  • The Aussie Dollar started a fresh increase above the 0.6720 and 0.6740 levels against the US Dollar.
  • There is a key bullish trend line forming with support near 0.6780 on the hourly chart of AUD/USD.
  • NZD/USD is showing a lot of bullish signs above the 0.6380 support zone.
  • There was a break above a major bearish trend line with resistance near 0.6360 on the hourly chart of NZD/USD.

AUD/USD Technical Analysis

The Aussie Dollar formed a base above the 0.6660 level and started a fresh increase against the US Dollar. The AUD/USD pair gained pace above the 0.6700 level to move into a positive zone.

There was a clear move above the 0.6720 level and the 50 hourly simple moving average. The bulls pushed the pair above the 50% Fib retracement level of the downward move from the 0.6850 swing high to 0.6668 low.

Image

AUD/USD Hourly Chart

The pair even climbed above the 0.6740 level and traded as high as 0.6778. It is now consolidating gains near the 0.6800 resistance zone.

On the upside, the AUD/USD pair is facing resistance near the 0.6810 level. It is near the 76.4% Fib retracement level of the downward move from the 0.6850 swing high to 0.6668 low. The next major resistance is near the 0.6850 level.

A close above the 0.6850 level could start another steady increase in the near term. The next major resistance could be 0.6920.

On the downside, an initial support is near the 0.6780 level. There is also a key bullish trend line forming with support near 0.6780 on the hourly chart of AUD/USD. The next support could be the 0.6740 level. If there is a downside break below the 0.6740 support, the pair could extend its decline towards the 0.6660 level.


Disclaimer: CFDs are complex instruments and come with a high risk of losing your money.
I trade at FXOpen

Please add www.kreslik.com to your ad blocker white list.
Thank you for your support.

User avatar
whiteking
rank: 150+ posts
rank: 150+ posts
Posts: 350
Joined: Fri Aug 11, 2017 2:25 am
Reputation: 32
Gender: None specified

Re: Daily analysis from FXOpen

Postby whiteking » Mon Dec 12, 2022 8:15 am

GBP/USD Reaches Key Support, USD/CAD Gains Bullish Momentum

Image

GBP/USD started a downside correction below 1.2250. USD/CAD is rising and might gain pace above the 1.3700 resistance zone.

Important Takeaways for GBP/USD and USD/CAD
  • The British Pound was able to move above the 1.2200 and 1.2250 resistance levels.
  • There is a key bullish trend line forming with support near 1.2220 on the hourly chart of GBP/USD.
  • USD/CAD climbed higher above the 1.3600 and 1.3620 resistance levels.
  • It cleared a major bearish trend line with resistance near 1.3660 on the hourly chart.

GBP/USD Technical Analysis

After forming a base above the 1.2100, the British Pound started a steady increase against the US Dollar. GBP/USD gained pace for a move above the 1.2150 and 1.2200 resistance levels.

There was a move above the 1.2250 resistance and the 50 hourly simple moving average. The pair even moved above the 1.2300 level and traded as high as 1.2322 on FXOpen. It is now correcting gains and trading below the 1.2300 level.

Image

GBP/USD Hourly Chart

Recently, there was a move below the 1.2280 and 1.2250 support levels. The pair declined below the 38.2% Fib retracement level of the upward move from the 1.2105 swing low to 1.2322 high.

It is now trading below the 1.2240 level and the 50 hourly simple moving average. On the downside, an initial support is near the 1.2220 area. It is near the 50% Fib retracement level of the upward move from the 1.2105 swing low to 1.2322 high.

There is also a key bullish trend line forming with support near 1.2220 on the hourly chart of GBP/USD. The next major support is near the 1.2190 level. If there is a break below 1.2190, the pair could extend its decline. The next key support is near the 1.2120 level. Any more losses might call for a test of the 1.2100 support.

An immediate resistance is near the 1.2250 level. The next resistance is near the 1.2280 level. The main resistance is near the 1.2325 level. If there is an upside break above the 1.2325 zone, the pair could rise towards 1.2400. The next key resistance could be 1.2500.

Disclaimer: CFDs are complex instruments and come with a high risk of losing your money.
I trade at FXOpen

User avatar
whiteking
rank: 150+ posts
rank: 150+ posts
Posts: 350
Joined: Fri Aug 11, 2017 2:25 am
Reputation: 32
Gender: None specified

Re: Daily analysis from FXOpen

Postby whiteking » Tue Dec 13, 2022 3:19 pm

#MarketNew #StockMarket

THE STOCK MARKET IS PREPARING FOR A TORNADO

On Monday, US stocks rose on a cautious positivity. Among the gainers are MSFT shares (nearly +3%), as Microsoft plans to buy a stake in the London Stock Exchange Group.

However, today, the release of data on inflation in the US is planned, tomorrow, we will hear from the Fed, and on Thursday, from the ECB. And moods will swirl like a tornado.

Reuters reports the opinion of Patrick Spencer, vice chairman of Baird investment bank, who believes that if today's consumer price index is weak, this will serve as a driver for the growth of shares.

The two-day chart of futures for the S&P 500 index shows that the price of the contract is near the upper line of the descending channel.

The bulls tried to push the price higher (1), but followed by (2) the response of the bears. We have a bearish engulfing pattern. Although it is not perfect in form, it clearly makes it clear that the strength of offers is high near the resistance line, and the bulls need momentum. Undoubtedly, favorable news on inflation can give it.

Image

FXO Markets Ltd Disclaimer: CFDs are complex instruments and come with a high risk of losing your money.

This forecast represents FXOpen Companies opinion only, it should not be construed as an offer, invitation or recommendation in respect to FXOpen Companies products and services or as financial advice.
I trade at FXOpen

User avatar
whiteking
rank: 150+ posts
rank: 150+ posts
Posts: 350
Joined: Fri Aug 11, 2017 2:25 am
Reputation: 32
Gender: None specified

Re: Daily analysis from FXOpen

Postby whiteking » Wed Dec 14, 2022 4:55 am

EUR/USD Gains Bullish Momentum While USD/CHF Dips Further

Image

EUR/USD gained pace above the 1.0600 resistance zone. USD/CHF is declining and remains at a risk of more losses below the 0.9240 support.

Important Takeaways for EUR/USD and USD/CHF
  • The Euro started a fresh increase above the 1.0550 resistance against the US Dollar.
  • There was a break above a major contracting triangle with resistance near 1.0565 on the hourly chart of EUR/USD.
  • USD/CHF started a fresh decline below the 0.9350 and 0.9315 support levels.
  • There is a key bearish trend line forming with resistance near 0.9360 on the hourly chart.

EUR/USD Technical Analysis

This week, the Euro started a steady increase from the 1.0450 zone against the US Dollar. The EUR/USD pair gained pace above the 1.0500 level to move into a bullish zone.

The pair even climbed above the 1.0600 resistance and settled above the 50 hourly simple moving average. During the increase, there was a break above a major contracting triangle with resistance near 1.0565 on the hourly chart of EUR/USD.

Image

EUR/USD Hourly Chart

It traded as high as 1.0672 on FXOpen and recently started a downside correction. There was a move below the 1.0650 level. The pair tested the 38.2% Fib retracement level of the upward move from the 1.0528 swing low to 1.0672 high.

On the downside, an immediate support is near the 1.0600 level. The 50% Fib retracement level of the upward move from the 1.0528 swing low to 1.0672 high is also near the 1.0600 zone.

The next major support is near the 1.0565 level. A downside break below the 1.0565 support could start another decline.

An immediate resistance is near the 1.0640 level. The next major resistance is near the 1.0675 level. A clear move above the 1.0675 resistance zone could set the pace for a larger increase towards 1.0750. The next major resistance is near the 1.0800 zone.


Disclaimer: CFDs are complex instruments and come with a high risk of losing your money.
I trade at FXOpen

User avatar
whiteking
rank: 150+ posts
rank: 150+ posts
Posts: 350
Joined: Fri Aug 11, 2017 2:25 am
Reputation: 32
Gender: None specified

Re: Daily analysis from FXOpen

Postby whiteking » Thu Dec 15, 2022 3:46 pm

ETHUSD and LTCUSD Technical Analysis – 15th DEC, 2022

Image

ETHUSD: Three White Soldiers Pattern Above $1222

Ethereum was unable to sustain its bearish momentum and after touching a low of 1222 on 08th Dec, the price started to correct upwards against the US dollar moving into a consolidation channel above the $1250 handle today in the European trading session.

We can see the formation of a bullish doji star pattern in the 1-hour time frame indicating bullish trends.

The commodity channel index indicator is giving a bullish divergence signal in the 1-hour time frame.

We can clearly see a three white soldiers pattern above the $1222 handle which is a bullish pattern and signifies the end of a bearish phase and the start of a bullish phase in the markets.

ETH is now trading just above its pivot level of 1286 and is moving into a consolidation channel. The price of ETHUSD is now testing its classic resistance level of 1287 and Fibonacci resistance level of 1288 after which the path towards 1300 will get cleared.

The relative strength index is at 48 indicating a NEUTRAL demand for Ether and the continuation of the consolidation phase in the markets.

The resistance of the channel is broken on the daily time frame.

The STOCHRSI is indicating an OVERBOUGHT level, which means that the prices are expected to decline in the short-term range.

Some of the technical indicators are giving a BUY market signal.

Most of the moving averages are giving a NEUTRAL signal due to the market consolidation seen below the $1300 handle.

ETH is now trading below both the 100 hourly simple and 200 hourly exponential moving averages.
  • Ether: bullish reversal seen above the $1222 mark
  • The short-term range appears to be mildly bullish
  • ETH continues to remain above the $1250 level
  • The average true range is indicating LESS market volatility
Ether: Bullish Reversal Seen Above $1222

Image

ETHUSD is now moving into a consolidation/correction channel with the price trading below the $1300 handle in the European trading session today.

The prices of Ethereum are ranging near the support of the channel indicating bullish trends.

The MACD indicator is now giving a bullish divergence signal in the 30-minute time frame.

The price of Ethereum broke the $1300 level and then we can see some decline due to short selling of Ether which caused the dip below the $1300 level.

ETHUSD touched an intraday high of 1314 and an intraday low of 1281 in the Asian trading session today.

We have seen a bullish opening in the markets this week.

The daily RSI is printing at 51 indicating a neutral demand for Ether in the long-term range.

The key support levels to watch are $1210 which is a 14-3 day raw stochastic at 30%, and $1244 which is a 38.2% retracement from 4 Week High.

ETH has decreased by 2.50% with a price change of 33.04$ in the past 24hrs and has a trading volume of 8.409 billion USD.

We can see an increase of 0.58% in the total trading volume in the last 24 hrs which appears to be normal.

The Week Ahead

The price of ETH has now entered into a consolidation/correction zone, and after this we are expecting fresh upside waves crossing the $1300 and $1400 levels.

ETHUSD continues to gain bullish traction from a weekly time frame from a 4-hour time frame with the bottom support located at $1075 touched on 22nd Nov.

The immediate short-term outlook for Ether has turned mildly bullish, the medium-term outlook has turned neutral, and the long-term outlook for Ether is neutral in present market conditions.

The price of ETHUSD will need to remain above the important support level of $1243 at which the price crosses the 18-day moving average.

The resistance zone is located at $1291 at which the price crosses 9-day moving average stalls.

The weekly outlook is projected at $1350 with a consolidation zone of $1300.

Technical Indicators:

The Williams percent range: is at -24.78 indicating a BUY

The commodity channel index (14): is at 62.01 indicating a BUY

High/Lows (14): is at 0.3436 indicating a BUY

Bull/Bear power (13): is at 0.6240 indicating a BUY

Cryptocurrency CFDs are not available to retail clients in the UK

Disclaimer: CFDs are complex instruments and come with a high risk of losing your money.
I trade at FXOpen

User avatar
whiteking
rank: 150+ posts
rank: 150+ posts
Posts: 350
Joined: Fri Aug 11, 2017 2:25 am
Reputation: 32
Gender: None specified

Re: Daily analysis from FXOpen

Postby whiteking » Fri Dec 16, 2022 2:40 pm

Gold Price Consolidates Losses, Crude Oil Price Could Correct Gains

Image

Gold price started a fresh decline below the $1,785 support zone. Crude oil price struggling near $78 and might correct gains in the near term.

Important Takeaways for Gold and Oil
  • Gold price faced resistance near $1,825 and corrected lower against the US Dollar.
  • There was a break below a key bullish trend line with support near $1,798 on the hourly chart of gold.
  • Crude oil price gained bullish momentum above the $72.00 resistance zone.
  • There is a major bullish trend line forming with support near $76.10 on the hourly chart of XTI/USD.

Gold Price Technical Analysis

Gold price traded high above the $1,810 resistance zone against the US Dollar. The price even cleared the $1,820 level, but the bears were active near the $1,825 zone.

A high was formed near $1,824 and the price started a fresh decline. There was a clear move below the $1,810 and $1,800 support levels. Besides, there was a break below a key bullish trend line with support near $1,798 on the hourly chart of gold.

Image

Gold Price Hourly Chart

The price settled below the $1,785 level and the 50 hourly simple moving average. It traded as low as $1,773 on FXOpen and is currently consolidating losses. On the upside, the first major resistance is near the $1,785 level.

The 23.6% Fib retracement level of the downward move from the $1,824 swing high to $1,773 swing low is also near the $1,785 level. The main resistance is now forming near the $1,800 level and the 50 hourly simple moving average.

The 50% Fib retracement level of the downward move from the $1,824 swing high to $1,773 swing low is also near the $1,800 level, above which it could even test $1,820. A clear upside break above the $1,820 resistance could send the price towards $1,840.

An immediate support on the downside is near the $1,772 level. The next major support is near the $1,760 level, below which there is a risk of a larger decline. In the stated case, the price could decline sharply towards the $1,750 support zone.

Read more...


Disclaimer: CFDs are complex instruments and come with a high risk of losing your money.
I trade at FXOpen

Please add www.kreslik.com to your ad blocker white list.
Thank you for your support.


Return to “forex”