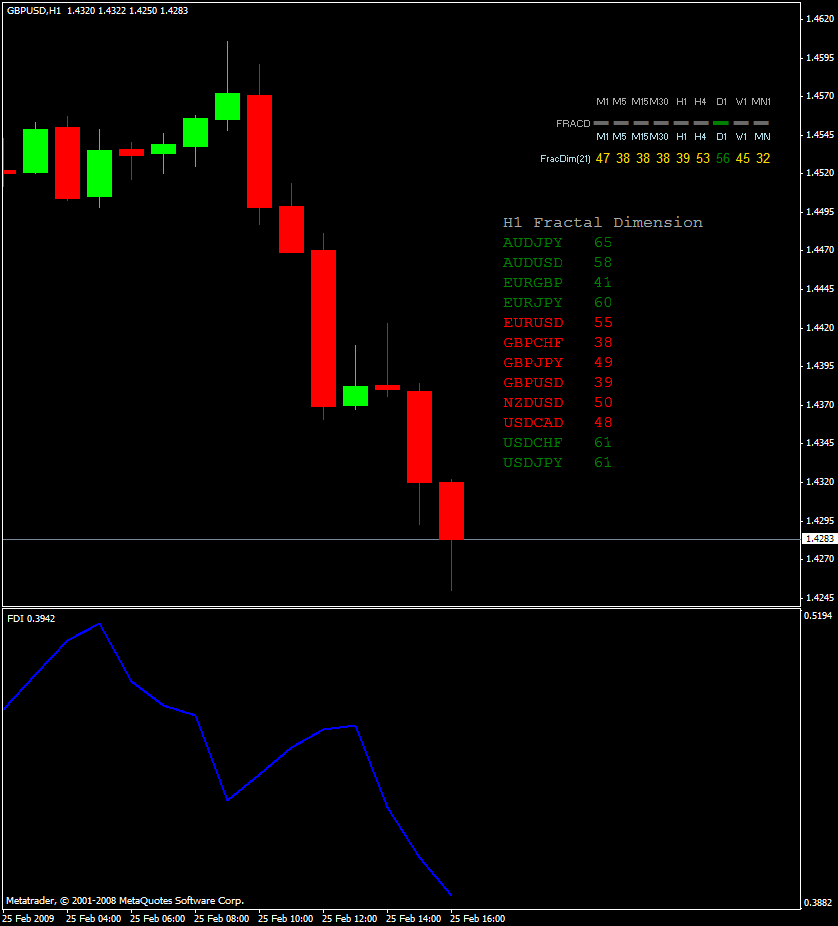
Dracozny wrote:i understand the FDI as you explained however the numbers in your TRO FDI indicators are completely different, bieng in the 30's 40's 50's 60's and red or green regardless of the number. can you please elaborate on that
Green means current value > previous value.
Red means current value < previous value.
Practically speaking, the most helpful thing about the fractal dimension is it gives us some idea what a chart is going
to do next. This comes from the key observation that markets move in a steady rhythm between trend and congestion.
Understanding and watching the progression of this rhythm, using the fractal dimension to quantify it,
can give us a good idea what a market is likely to do next.
If a market has been in a long period of congestion -- with a high reading on the fractal dimension --
then we can assume that the next major move will be a trend. We can also use the fractal dimension to recognize
when the market is "self-organizing" itself into a trend, which is the way a market evolves and
adapts to new energy (money) coming into or out of the system.
When the fractal dimension moves from high levels down through 55, we have a good idea that a trend is starting,
and that it will likely continue down towards the 30 area, where trends tend to lose energy and stop.
Conversely, when a trend has reached a fractal dimension reading of 30,
we have a pretty good idea that the trend has run its course,
and a consolidation or retracement is now about to unfold.
The fractal dimension readings then move up during congestion periods.
Of course, there are always exceptions and outliers, but those can be cataloged too.
A financial market always needs to be approached with the mindset that we can never know exactly what it will do,
but we can have a pretty good idea about how it will adapt and evolve, greatly increasing the likelihood of success.
READ THIS


