I reloaded _TRO_BuyZone and it does show up now. Although I do have an algorithm that tested OK for the USDJPY, I'm not trading Forex currently so the inputs here won't work for me. (SIPC broker protection doesn't cover Forex, right?) For stocks I could change the inputs to an ATR or Standard Deviation but that doesn?t flow in a straight line. Keltner and Bollinger bands can be used for that. Fibs and previous OHL can provide good pivots I'm told.
You can't see the price candles because the price range has moved below the _TRO_BuyZone.
This begs the question for those that will be using this indicator:
?How does one ?reset? the day?s opening price every hour? Does one simply sign off and on again to your data stream?? Signing out and back in didn't reset the open on TS after-hours (5:45 EST) didn't reset the open. Of course with stocks the open is the 9:30 Am price and you wouldn't want to reset that.
Thanks very much for posting your helpful hints Mo & TRO.
TheRumpledOne Donational Indicators
Moderator: moderators
-
4tradinggreen
- rank: <50 posts

- Posts: 14
- Joined: Mon Nov 10, 2008 1:02 am
- Reputation: 0
- Location: palm trees & sunshine
- Gender:

- Contact:
Please add www.kreslik.com to your ad blocker white list.
Thank you for your support.
Thank you for your support.
-
4tradinggreen
- rank: <50 posts
- Posts: 14
- Joined: Mon Nov 10, 2008 1:02 am
- Reputation: 0
- Location: palm trees & sunshine
- Gender:
- Contact:
-
prasath2008
- rank: <50 posts
- Posts: 5
- Joined: Fri Nov 14, 2008 3:22 pm
- Reputation: 0
- Gender:
- Contact:
-
prasath2008
- rank: <50 posts
- Posts: 5
- Joined: Fri Nov 14, 2008 3:22 pm
- Reputation: 0
- Gender:
- Contact:
-
prasath2008
- rank: <50 posts
- Posts: 5
- Joined: Fri Nov 14, 2008 3:22 pm
- Reputation: 0
- Gender:
- Contact:
Please add www.kreslik.com to your ad blocker white list.
Thank you for your support.
Thank you for your support.
-
TheRumpledOne

- rank: 10000+ posts

- Posts: 15556
- Joined: Sun May 14, 2006 9:31 pm
- Reputation: 3035
- Location: Oregon
- Real name: Avery T. Horton, Jr.
- Gender:

- Contact:
kindly explain the setting for the rule of thumb trigger
what is my threshold
NOT USED - FOR FUTURE DEVELOPMENT
what is pip trigger
NOT USED - FOR FUTURE DEVELOPMENT
what is SR Bars
Number of bars to use to find the highest high and lowest low.
what is SR shift
Number of bars to shift back to start finding the highest high and lowest low.
So if you have SR Bars = 3 and SR shift = 1, then you look at bars 1,2 and 3. Bar 0 is the current bar but you don't use that because you shifted back 1 bar.
what is KOD 217
what is KOD 218
what is KOD 142
The KOD inputs determine the characters that are displayed on the chart - the arrowheads.
what is style 1
line type
what is style2
line type
what is wing ding1
what is wing ding2
wingding characters to use on the charts
what is the settings for use it in commodities
I don't know, I don't trade commodities.
Just play with the inputs and see what happens! You can't break anything.
IT'S NOT WHAT YOU TRADE, IT'S HOW YOU TRADE IT!
Please do NOT PM me with trading or coding questions, post them in a thread.
Please do NOT PM me with trading or coding questions, post them in a thread.
-
TheRumpledOne
- rank: 10000+ posts
- Posts: 15556
- Joined: Sun May 14, 2006 9:31 pm
- Reputation: 3035
- Location: Oregon
- Real name: Avery T. Horton, Jr.
- Gender:
- Contact:
TRO DASHBOARD PIPDIFF
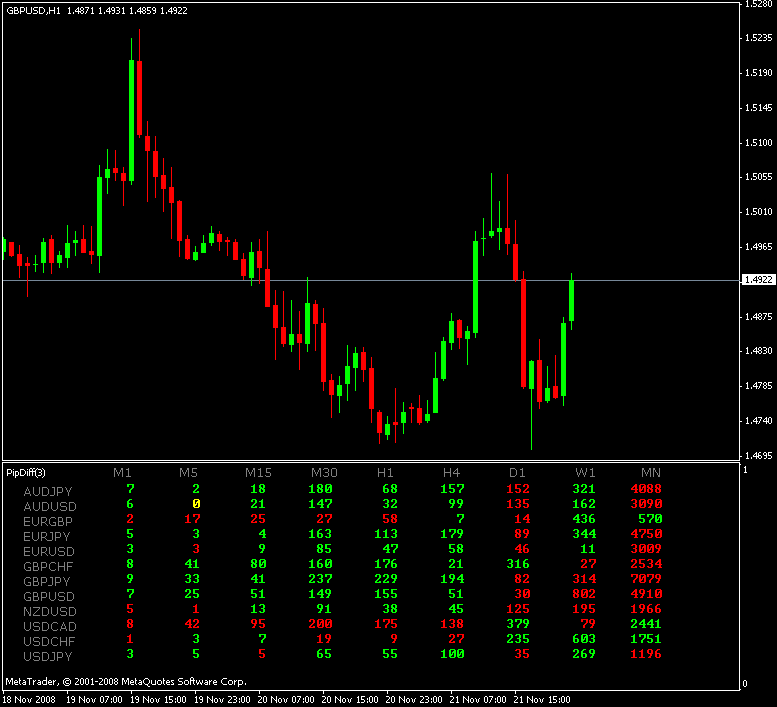
TRO DASHBOARD PIPDIFF displays the difference between the current price and the open price X bars ago ( X = 3 default ) for multiple pairs and time periods.
Simple indicator that shows "trend" or which way the price is moving.
Easy to see if what currencies are strong vs which ones are weak.
TRO DASHBOARD PIPDIFF displays the difference between the current price and the open price X bars ago ( X = 3 default ) for multiple pairs and time periods.
Simple indicator that shows "trend" or which way the price is moving.
Easy to see if what currencies are strong vs which ones are weak.
IT'S NOT WHAT YOU TRADE, IT'S HOW YOU TRADE IT!
Please do NOT PM me with trading or coding questions, post them in a thread.
Please do NOT PM me with trading or coding questions, post them in a thread.
-
lazymaritimer
- rank: <50 posts
- Posts: 1
- Joined: Sat Nov 29, 2008 1:23 am
- Reputation: 0
- Gender:
Hi Avery and all,
I have been using TRO indicators on some demo accounts for a couple days now. There is a learning curve, but of the last 17 trades (today), 15 winners, 1 BE, 2 losses. The two losses were only caused by improperly placed SL on pending orders. Only grabbing 2-5 pips per trade right now, as the demo brokers spread is killing me, but it is working CONSISTENTLY!
Thanks!
-
TheRumpledOne
- rank: 10000+ posts
- Posts: 15556
- Joined: Sun May 14, 2006 9:31 pm
- Reputation: 3035
- Location: Oregon
- Real name: Avery T. Horton, Jr.
- Gender:
- Contact:
Please add www.kreslik.com to your ad blocker white list.
Thank you for your support.
Thank you for your support.