"Very simple, but not EASY For most"
"Then hold onto your nuts long enough to get at least 1/2 way to the other "edge" of the chart. "
Yeah, humans are not good at long term planning They must have immediate results and be day trading / scalping.
The ideas that I trade by:
Moderator: moderators
- PebbleTrader
- rank: 1000+ posts
- Posts: 1633
- Joined: Fri Nov 12, 2010 2:15 am
- Reputation: 15
- Gender:
Please add www.kreslik.com to your ad blocker white list.
Thank you for your support.
- PebbleTrader
- rank: 1000+ posts
- Posts: 1633
- Joined: Fri Nov 12, 2010 2:15 am
- Reputation: 15
- Gender:
- trueblueTEX
- rank: 500+ posts
- Posts: 532
- Joined: Mon Apr 12, 2010 4:38 pm
- Reputation: 2
- Gender:
- Captain Pugwash
- rank: 500+ posts
- Posts: 529
- Joined: Wed Sep 14, 2011 7:59 am
- Reputation: 166
- Location: Insanitary Industries
- Gender:
trueblueTEX wrote:It's uncanny how I sell and price goes up and how I buy and price goes down.
A few links down you will see some Sam Seiden Videos - enjoy
Thanks Tyger
"MOJO 1)Self-confidence, Self-assuredness. As in basis for belief in ones self in a situation. Esp/In context of contest or display of skill such as going into battle. 2)Ability to bounce back from a debilitating trauma and negative attitude YEH BABY
Please add www.kreslik.com to your ad blocker white list.
Thank you for your support.
- trueblueTEX
- rank: 500+ posts
- Posts: 532
- Joined: Mon Apr 12, 2010 4:38 pm
- Reputation: 2
- Gender:
I've been looking at the AUD/USD this week and I posted a pic a few days ago. Well, last night I was looking at it and decided that price had gone up and pulled back and was still going up so I would buy into that off of the fibo that I had drawn a couple of days ago.
The middle gold line below is the weekly low and it WAS at the bottom of the trough on the 28th. I bought 8 lots as I was on the 8 lot line. Green line appeared and I thought hey, look at that resistance line. And price shot down.
Thanks for link Cap'n.
The middle gold line below is the weekly low and it WAS at the bottom of the trough on the 28th. I bought 8 lots as I was on the 8 lot line. Green line appeared and I thought hey, look at that resistance line. And price shot down.
Thanks for link Cap'n.
- PebbleTrader
- rank: 1000+ posts
- Posts: 1633
- Joined: Fri Nov 12, 2010 2:15 am
- Reputation: 15
- Gender:
- TygerKrane
- rank: 1000+ posts
- Posts: 1733
- Joined: Mon Jan 25, 2010 3:36 pm
- Reputation: 297
- Location: Long Island, NY
- Gender:
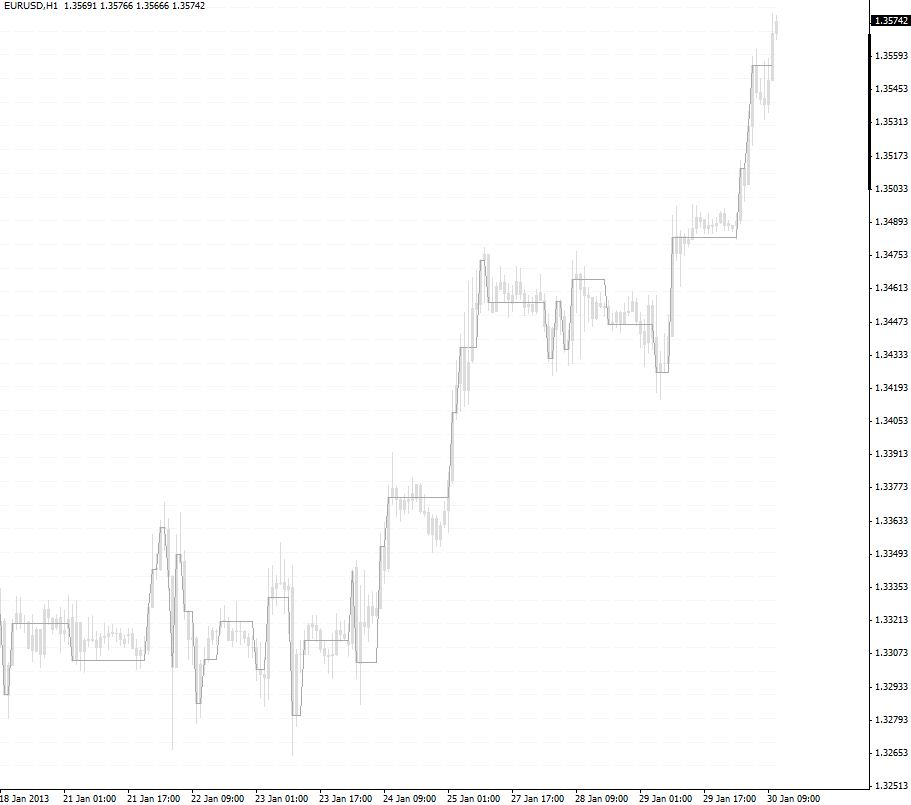
PebbleTrader wrote:This is what I am leaning towards this year for my chart setup.
It's a step chart that is based on the close beyond an extreme idea I talked about awhile back.
Seriously?
Just one time frame?!?
EDIT:
I'm not trying to say trading one timeframe is impossible. I'm just saying that I thought you (PebbleTrader) were more of a longer term trader, so I figured you preferred more information to make your longer term trading blueprints.
**Krane catches Tyger** !>I'm here to chew bubble gum and make major pips...and I'm all out of bubble gum.<!
- TygerKrane
- rank: 1000+ posts
- Posts: 1733
- Joined: Mon Jan 25, 2010 3:36 pm
- Reputation: 297
- Location: Long Island, NY
- Gender:
trueblueTEX wrote:I've been looking at the AUD/USD this week and I posted a pic a few days ago. Well, last night I was looking at it and decided that price had gone up and pulled back and was still going up so I would buy into that off of the fibo that I had drawn a couple of days ago.
The middle gold line below is the weekly low and it WAS at the bottom of the trough on the 28th. I bought 8 lots as I was on the 8 lot line. Green line appeared and I thought hey, look at that resistance line. And price shot down.
Thanks for link Cap'n.
Ummm, isn't your fib tool upside down in the pic??
If your intentions are Long, shouldn't "00" be on the bottom?
**Krane catches Tyger** !>I'm here to chew bubble gum and make major pips...and I'm all out of bubble gum.<!
- trueblueTEX
- rank: 500+ posts
- Posts: 532
- Joined: Mon Apr 12, 2010 4:38 pm
- Reputation: 2
- Gender:
TygerKrane wrote:trueblueTEX wrote:I've been looking at the AUD/USD this week and I posted a pic a few days ago. Well, last night I was looking at it and decided that price had gone up and pulled back and was still going up so I would buy into that off of the fibo that I had drawn a couple of days ago.
The middle gold line below is the weekly low and it WAS at the bottom of the trough on the 28th. I bought 8 lots as I was on the 8 lot line. Green line appeared and I thought hey, look at that resistance line. And price shot down.
Thanks for link Cap'n.
Ummm, isn't your fib tool upside down in the pic??
If your intentions are Long, shouldn't "00" be on the bottom?
It's symmetrical ala MO. The bottom "00" is hidden under the "incorrect" Insanity Logo.
Now that I have the fibo like MO's I am trying to figure out how to use it like MO. I am sure I am no where near there, yet.
Please add www.kreslik.com to your ad blocker white list.
Thank you for your support.