The ideas that I trade by:
Moderator: moderators

Please add www.kreslik.com to your ad blocker white list.
Thank you for your support.
Thank you for your support.
-
Captain Pugwash

- rank: 500+ posts

- Posts: 529
- Joined: Wed Sep 14, 2011 7:59 am
- Reputation: 166
- Location: Insanitary Industries
- Gender:

nimo350 wrote:
Thanks Bredin, I guess that also allows additional entries to be made with less precision?
.
Exactly
"MOJO 1)Self-confidence, Self-assuredness. As in basis for belief in ones self in a situation. Esp/In context of contest or display of skill such as going into battle. 2)Ability to bounce back from a debilitating trauma and negative attitude YEH BABY
-
bredin

- rank: 1000+ posts

- Posts: 1033
- Joined: Mon Feb 16, 2009 10:41 pm
- Reputation: 7
- Gender:

- Contact:
The same PA used to take the longs can be found on the shorts, but the lotsize should be smaller since youre really waiting for R->S
MOMO over extreme means an order imbalance exists somewhere before the breakout. stf will show the exact place. wait for price to be back at the imbalance. the bigger the tf that the imbalance can be seen on the more powerful it is.
However, I will reiterate that the example really shows Positioning, not pretty entrances.
When I discussed this on the weekend, we talked about everything *except* entries.
ask yourself why we didnt bother with that.
G.
Welcome to the era of "Guns and Maskies" Trading!
The previous message contains discretion. Viewer nudity is advised.
Insanity Industries Indicators Here
Insanity Industries on YouTube!
The previous message contains discretion. Viewer nudity is advised.
Insanity Industries Indicators Here
Insanity Industries on YouTube!
-
PebbleTrader

- rank: 1000+ posts
- Posts: 1633
- Joined: Fri Nov 12, 2010 2:15 am
- Reputation: 15
- Gender:
Leap Motion - Control Your Charts "Minority Report" Style!
Just imagine zooming in and out of the EUR/USD and panning around with your hands!
You can preorder the leap now and it is only $69
Just imagine zooming in and out of the EUR/USD and panning around with your hands!
You can preorder the leap now and it is only $69
Life is just a journey
Please add www.kreslik.com to your ad blocker white list.
Thank you for your support.
Thank you for your support.
-
trueblueTEX

- rank: 500+ posts
- Posts: 532
- Joined: Mon Apr 12, 2010 4:38 pm
- Reputation: 2
- Gender:


mob wrote:MightyOne wrote:My fib looks like this:
04 units (##)
05 units
06 units
08 units
12 units
16 units
00 Position
Mo, would you be so kind and re-confirm the levels / calculation for the given fibo descriptions? I presently use these which you posted quite a while ago...
04 units (##) Lvl 1
05 units - lvl 0.5
06 units - lvl 0.666
09 units - lvl 0.444
12 units - lvl 0.333
16 units - lvl 0.222
00 Position
Thks
Mop
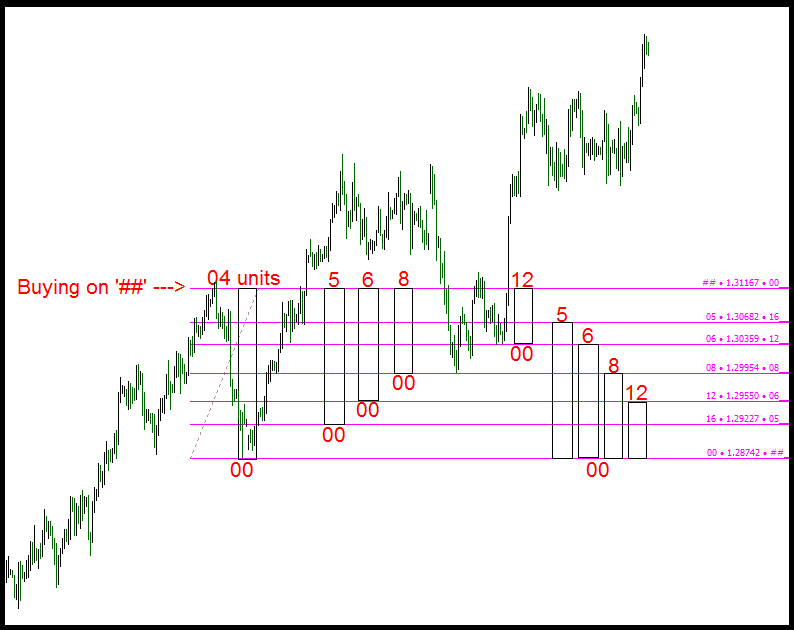
Make sure that you are using the ret tool:
04 units - lvl 0 <--- '##'
05 units - lvl 0.2 <--- +25% size
06 units - lvl 0.3334 <-- +50% size
08 units - lvl 0.5 <--- DOUBLE
12 units - lvl 0.6667 <--- TRIPLE
16-20 units - lvl 0.8 <--- QUADRUPLE size!
00 units - lvl 1 <--- '00'
If you liquidate 08 units then 08 units = ##
you could then reenter on 0.5 with 16 units or .3334 with 12 units.
I chose these sizes because they are close to Fibonacci spacing and the tool does not have to be reversed when switching from long trades to short.
If you do not use a 'balanced' RET tool then constantly reversing your tool is a nightmare on small charts esp. if your Fib tool does not measure between ## and 00 while you are sizing the box.
Take a look at what happens when you buy on ## VS buying on a RET:
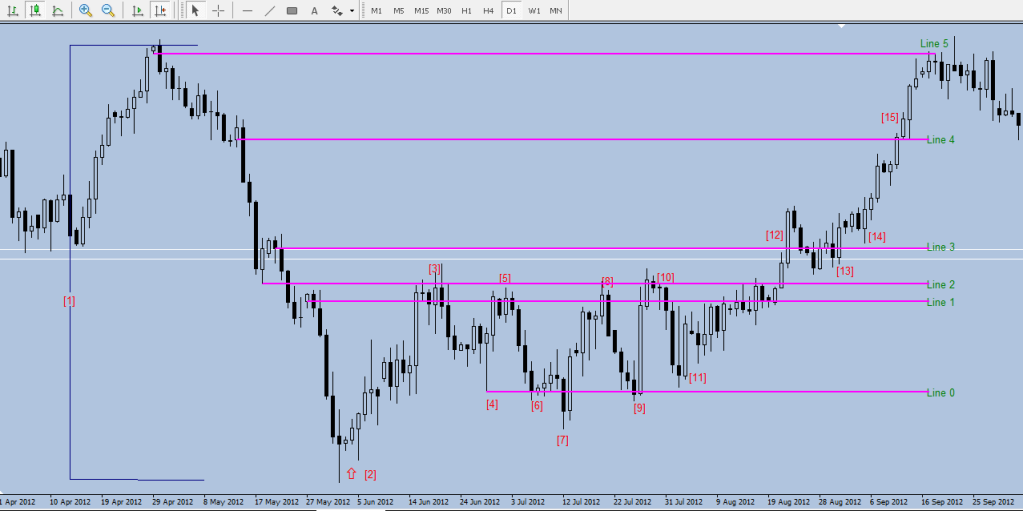
nimo350 wrote:Maybe I can type out how I see the price action, at the risk of embarrassing my self.
I do hope its remotely close to how successful traders see this price action. Maybe get a passing grade somehow, even if looking at it in hindsight.
[1] Here I see price creating a vacuum from one extreme to another.
As MO would say, the biggest pay out is at the D+ extreme, so I would wait for signs of price returning to see what I can capture.
[2] Partial entry - long (entry x 1)
Here I see short candle bodies getting smaller, and the last short candle may be interpreted as not closing lower.
In addition, I see bodies closing higher, at an extreme end. This may be interpreted as price showing a desire to go long.
I would enter at a daily extreme on a lower TF, with partial position, and see what happens.
[3] Exit partial entry - wait to buy back on RET.
Lines marked 1-5 can be interpreted as possible price areas where price may 'pause' and RET, perhaps an opportunity to exit and enter on a retrace, thus building position/space/lots.
Since I don't know what price will do, but have a feeling price will retrace, I'll probably exit and wait.
[4] Here I see price making a 'bottom' with a wick, it can possibly be viewed as establishing a box range - with line 1 and 2 being supply, and line 0 being demand.
[5] Here I see price established some sort of range from [3] to [4], and price returning to the top of that range.
Although I can attempt a short, to build more space, I don't like the strong long candle just before [5], and also MO said to trade one direction.
I would probably do nothing and wait to see if price return to the bottom of this range.
[6] Here I see price returning to the bottom of the range, but I also see short candle bodies closing lower, and not showing much weakness.
I can try to simply go long on bodies closing higher, but I'd do so with caution.
[7] Here is where I'd have trouble, as this long short body closed lower, as hinted by earlier bodies closing short.
I wouldn't know what to do here, I know I would like to go long, but I don't see anything that would persuade me to do so.
[8] Here I see price once again reaching the top of the range, then falling to the bottom again.
[9] add to position (entry x 2)
This time I see short bodies showing weakness, and not closing lower, good chance to add position.
Risk remains the same as first entry.
[10] Here I see huge momo candle going long, reaffirming prices' desire to go long, possibly to line 4 or line 5.
Even though price is reaching the top of the box range, with possible RET again, I'd likely hold on to my position and not exit.
[11] add to position (entry x3)
Here I see price RET a bit, with short bodies weakening, and a long momo body, again.
The following 3-4 candles show a desire to go long, I would likely add another position, as price is showing support in the bottom half of the long momo body.
3 entries have been made at this point, my average should be outside of line 0, beyond daily extremes.
[12] Here I see bodies closing higher, beyond line 3 on strong candles, and a desire to reach for line 4.
[13] Here I see price returning to the area of line 1 and line 2, but I should be safe with my exit below line 0.
[14] possible additional entry can be made here, I guess?
[15] Line 4 can be an exit point? Although I do see price not showing any weakness, as it closes higher, beyond line 4.
Maybe exit partial position, and let it run to line 5?
----
Would this be considered a passing grade? Do I make enough to buy water and crackers?
Forget about reading the chart (at least for now) and simply focus on growing your position size.
Your only entry is your STOP LOSS ('00')
The only things that matter are:
a) price moves to your stop loss.
b) price moves away from your stop loss carrying a large position.
all the TA in the world will not change that.
Please add www.kreslik.com to your ad blocker white list.
Thank you for your support.
Thank you for your support.