elkin.fernandez wrote:Some doubts:
These two bars are two scenarios of the same bar?
How does it help us? In order to know what are doing the price?.
This applies for all timeframes?.
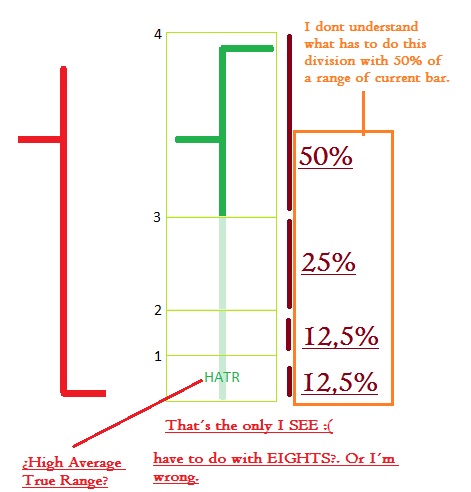
HATR = Hourly Avg. True Range
Moderator: moderators


elkin.fernandez wrote:Some doubts:
These two bars are two scenarios of the same bar?
How does it help us? In order to know what are doing the price?.
This applies for all timeframes?.


MightyOne wrote:A weekly color strength indicator?
I'll have to check to see if TRO already has something similar...
3 box reversal, why not?
color_strength.png

 IS A LIE__________

MightyOne wrote:
How does bar one turn into bar two without rising above (O+L)/2 or changing color?
only red bars push on the lows and only green bars push on the highs; there is no way around this.
If you enter at the midpoint then you will make at least half of the resulting range: so if every monthly bar is 500 pips then you will make 250 pips as long as price can match the previous low (red candles will likely remain red)
range.png
Smaller charts are bullish nearer to the extreme where as larger charts are bullish at higher price levels.
You can also give thought to how a bar appears and what it might look like after a retrace or by the close of the bar: this visualization can help with selecting entries and exits.


MightyOne wrote: No matter what method you use, it is a horizontal line in the end.

TheRumpledOne wrote:Wish I understood what you mean by "risk lines/make lines".

