I don't know how much interest there is in it, but I promised the logic to the adaptive trail stuff that I posted a couple of pages ago. So here goes...
The idea was to have the trail look back a certain number of bars based on how fast the market is moving. To calculate the number of bars, I needed something that reflects the movement, but is not open-ended. So i figured that it would have to be some sort of oscillator.
I tried various oscillators, but none quite fit. Chanda Momentum Oscillator, Williams %R, DeMarker, etc, all had shortcomings. I'm sure my solution does too, but I liked it best. Basically, I constructed my own oscillator out of the RT indicator from our old friend Signal Bender (circa 2011).
The elements of RT:
Up = current close - previous low
Down = previous high - current close
Looking back, I add up each of these over some number of bars (I currently use 9). If the sum is <0, set it =0.
Numerator is the result for Up. Denominator is Up + Down.
Result is [SumUp/(SumUp + SumDown)].
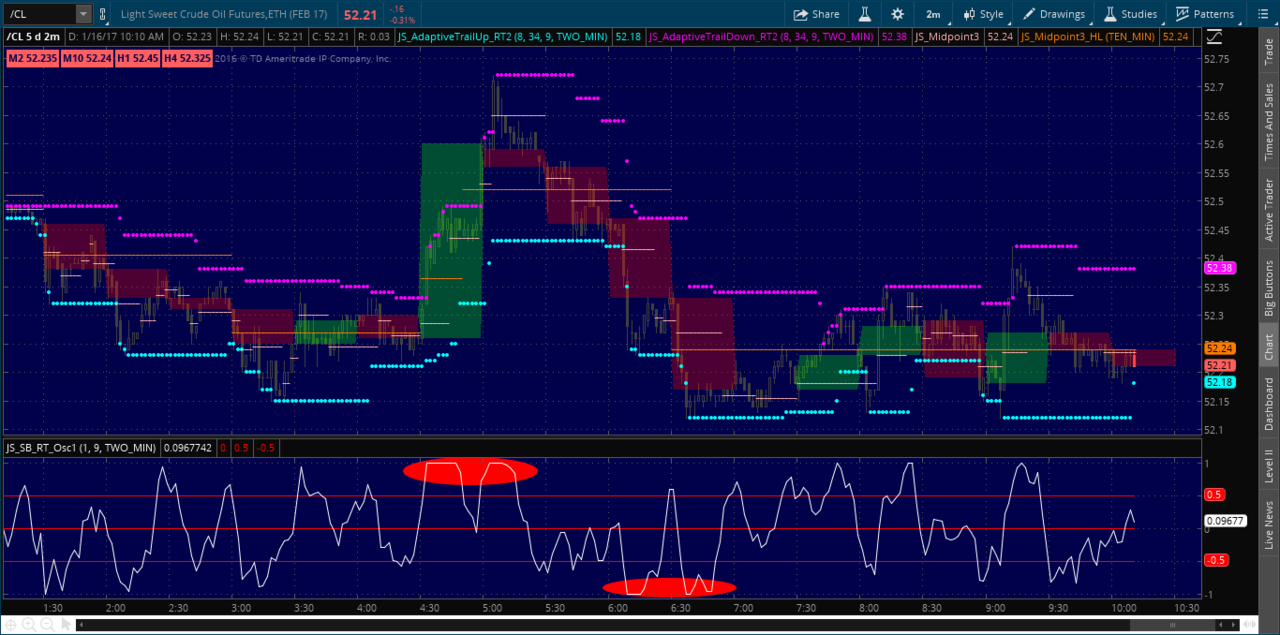
This gives a value from 0 to 1. I double it and subtract 1, so that I get a result from -1 to +1. The nearer to the extremes, the stronger the move (see the red ovals in the chart below).
If the result is <0, for the up trail I use 0 and I use the -result for the down trail. If the result is >0, I use the result for the up trail and 0 for the down trail.
Up => if result < 0, modres = 0, else modres = result
Down => if result > 0, modres = 0, else modres = -result
I have 2 inputs for the minimum and maximum number of bars to look back. Mine are set for 8 bars and 34 bars. Then I use the oscillator result as a percentage to interpolate between the min and max.
diff = max - min
adder = ceiling(diff * (1 - modres))
lookback = min + adder.
So if [modified result, modres] is near 1, adder will be small and [lookback] is near the min (8). If [modres] is near 0, adder will be large and [lookback] is near the max (34). To trail down, I use the high [lookback] bars ago. To trail up, I use the low [lookback] bars ago. That's it.
I also have mine set up so that I can use higher time frames for the calculations. Useful for keeping an eye on what matters while looking at small charts. Also, note that I calculate this with previous bars (not the current bar), so the value does not change while a bar is still live.
I find this tool makes it easy to eyeball a good location to trail a stop. Along with the midpoint tools I have shown (lines and dashboard), it is all I have on my charts. Though on smaller charts I will often also put a higher time frame CC.


 IS A LIE__________


