

I am not trying to predict what happens next.
These are the steps that I take:
Position in the market at a long term pointy place.
# of lots that I can accumulate prior to a long term move.
Waiting for the expansion of a long term range.
-It doesn't matter if the trade is long term or short, my max. risk MUST (MUST MUST MUST!) be from a long term pointy place.
-It is actually easier to get your hands on a large lot size if you take 1 or 2 short legs of gained space and inject the gains into your fibo. tool to bring the larger lot sizes closer to you.
-No one knows what is going to happen next; they can highly suspect but no one knows! What we do know is that short term ranges expand into long term ranges from one pointy place or the other. If you start with a small chart and start clicking up to higher chart periods, as price moves in the direction of profit, then you should(?) find yourself trading in the long term
direction.
The ideas that I trade by:
Moderator: moderators
Please add www.kreslik.com to your ad blocker white list.
Thank you for your support.
Thank you for your support.
-
Karma
- rank: 50+ posts

- Posts: 145
- Joined: Sat Jun 04, 2011 11:59 am
- Reputation: 0
- Location: South Florida
- Gender:

I suppose I'm stuck in the grey area between predicting the future and being prepared for everything.
Am I predicting, or reading what the gods are writing?
It's taken time but I'm beginning to understand position sizing, shrinking your space as you gain too much and shedding lots to create more when you need it.
Am I predicting, or reading what the gods are writing?
It's taken time but I'm beginning to understand position sizing, shrinking your space as you gain too much and shedding lots to create more when you need it.
-
Braathen

- rank: 500+ posts

- Posts: 615
- Joined: Mon Jul 20, 2009 6:21 pm
- Reputation: 15
- Location: Infront of the PC O_o
- Gender:
Hi MO! 
I have a scenario id like to lay out.
Maybe you could tell me how far off i am
Price leg is made on a 1m chart. Position/Space is set at long term extreme.
10$ with 33 pips space. No actuale trade has been made yet.
Price come back into the leg making the range i want to expand.
50% ret is hit (doesnt have to be 50%) 3/6-1 = 0.5 so enter 6 lots with 16.6 pips in space left.
Start shedding when price is make a new leg or comes against
me into 83.33% S/D.
Bulk profits ontop of original risk. If i started with 10$ and got 32 pips
with 0.6 lots thats nearlly 20$. So next trade would be 30$ risk.
30$/0.9 lots = 33,3 pips of space , 9/17 - 1 = 0.47%
So at a 47% ret on the next trade i could enter 17 lots with 17.6 pips of space left. I think anyway... im endlessly horrible at math.
As always i really enjoy reading your posts. Thanks for trying.
Have a good weekend
"Trading is the ability to see & to plan & to act; it is not crystal balls, precision entries, and ego stroking."
MO-
MO-

Please add www.kreslik.com to your ad blocker white list.
Thank you for your support.
Thank you for your support.
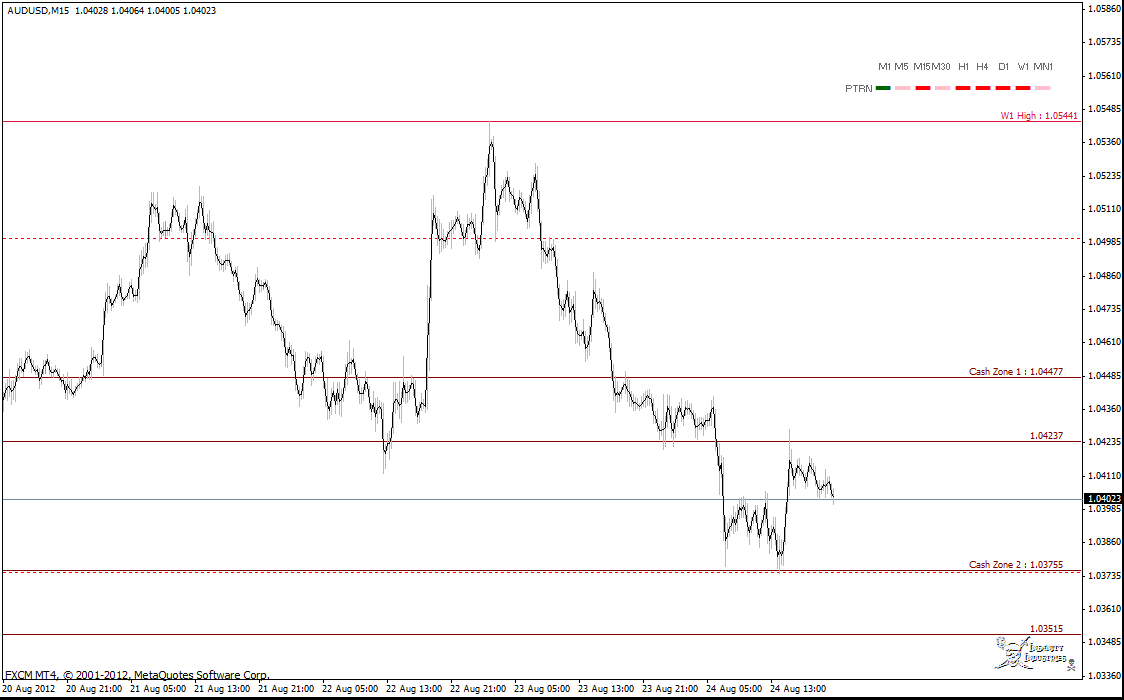
After creating the 'Crash Zone', TRO thought that it should be called the 'Cash Zone' & ever since then we have been using those names interchangeably.
The Crash/Cash zone is a projection from the active candle's price extreme using the median range of the last three weeks * 4/6, 5/6, 7/6, & 8/6.
Rarely will price break up and out of zone 2 for a true weekly mbar.
The Crash/Cash zone is a projection from the active candle's price extreme using the median range of the last three weeks * 4/6, 5/6, 7/6, & 8/6.
Rarely will price break up and out of zone 2 for a true weekly mbar.
Braathen wrote:Hi MO!
...Bulk profits ontop of original risk. If i started with 10$ and got 32 pips
with 0.6 lots thats nearlly 20$. So next trade would be 30$ risk....
I wouldn't keep increasing my risk.
It is better to build a large lot size from gained space and remove your money from the equation as soon as possible.
-
Braathen
- rank: 500+ posts
- Posts: 615
- Joined: Mon Jul 20, 2009 6:21 pm
- Reputation: 15
- Location: Infront of the PC O_o
- Gender:
[/quote] I wouldn't keep increasing my risk.
It is better to build a large lot size from gained space and remove your money from the equation as soon as possible.[/quote]
So after the gain i would stick my 10$ in my pocket.. and call my 20$ gain my space.
Thank you for your reply.
I have a ton of questions but i really am bad at posting.. and will wait
until i feel my questions are better
"Trading is the ability to see & to plan & to act; it is not crystal balls, precision entries, and ego stroking."
MO-
MO-
I have made a few minor adjustments:
I target the weekly, monthly, & quarterly extremes.
I will use a daily open as an extreme on a short term chart.
I also consider the 250 & 250+(half) levels to be important.
My trade chart is a 7 minute chart simply because there are 1440 minutes in a day and 1440 7M candles in a week; you could say that the 7M chart is the 'minute chart' of the weekly candle (or pseudo daily candle).
As you know, I use the fibo tool's rets for position sizing:
Size to 3 lots then rets at: 4, 5 , 6, 9, 12, & 18 lots.
I am trying to trade with 1.5% risk on a 7M chart w/ a max.
weekly loss of 4.5% as per usual.
Please add www.kreslik.com to your ad blocker white list.
Thank you for your support.
Thank you for your support.