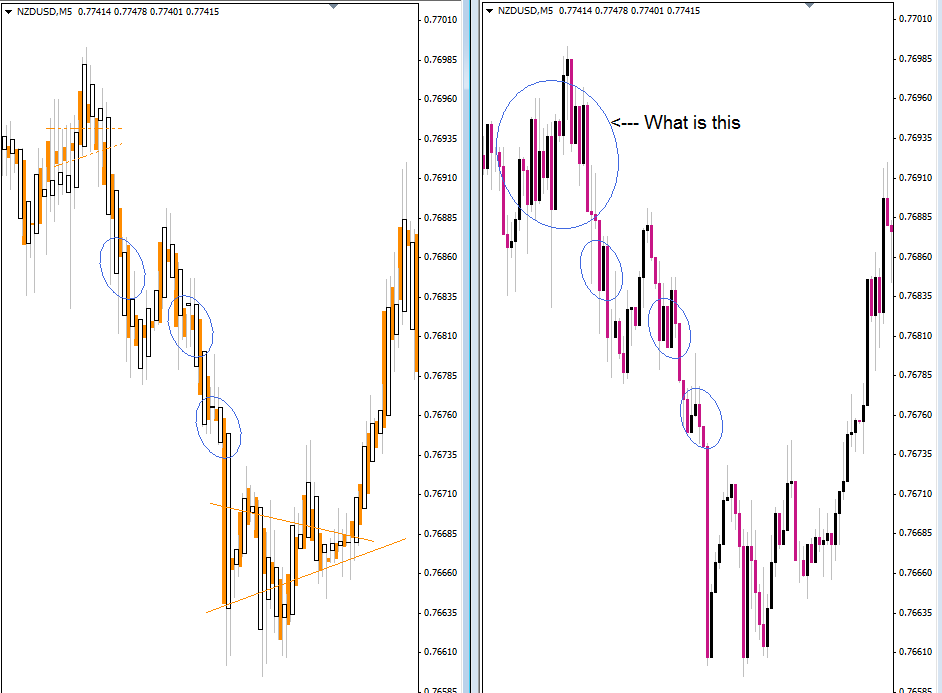
TheRumpledOne wrote:Hey MO... I don't understand the difference between the 2 NZD charts. What am I missing?
They both are M5. Is one some type of HA? The black/purple has shorter tails on the bottom than the orange/white chart.
Well sir, on the right we have your trusty candlestick chart with 'perfect opens' (open = prev. close).
On the left we have what seems to be a chart that is impossible to describe

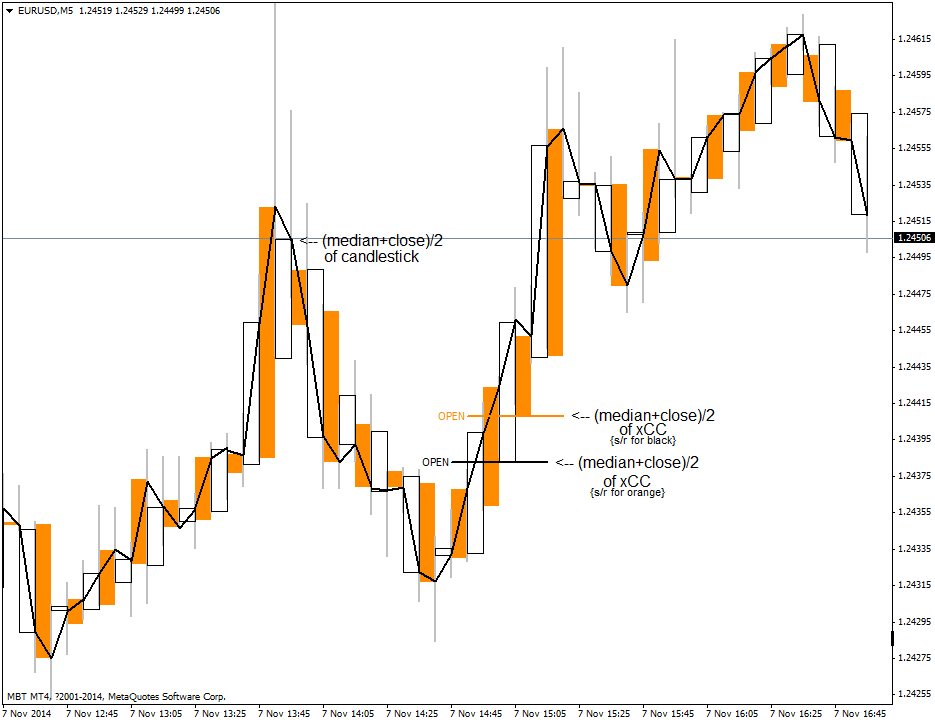
Both the black and orange xCC close at the (midpoint+close)/2 of the candlestick chart and work together to form a line chart; that is to say that when both xCC are on one chart they accurately describe the underlying candlestick chart.
If there were only one color then it would be a true CC, candles would be skipped, and it would be a higher chart period.
The chart reduces the visible volatility in two ways:
1) by shifting the open and close to an average, xCC that try to reverse or saw about are dramatically reduced in size; weakening the appearance of weak moves accentuates the strong moves.
2) the 'line chart' is then divided into two colors to give the illusion of a higher chart period & artificial opens are given to turn the lines into something that we can read and understand; candles!
Since individually the CC look like a higher period it tricks your eyes into not seeing so many zigzags.
For more information please see the mq4 file