doji
The ideas that I trade by:
Moderator: moderators
Please add www.kreslik.com to your ad blocker white list.
Thank you for your support.
Thank you for your support.


dojirock wrote:MO, I stare at this till my eyes are going to explode!
This is what I see, Price seems to be expanding every cone sequence.
YET when I trade live, I always see the cones as shrinking thus not trading them due to the decrease in room to make profit.
Am I on the wrong side of the zline in a sense?
Do i just need to learn to see them as expanding instead of decreasing?
Im baffeled by your ability to see this stuff. But im not giving up.
doji
Cones do not 'shrink'...
they are more like moving tornadoes that throw objects away from center only to swing them back in the other direction
I spent 13 years studying triangles, the only way you are going to understand them is to throw away the textbook idea of triangles and re-learn to draw them.
Once you can draw them then you can see them, one you can see them you can observe them, once you observe them then you can begin to understand them.
-
dojirock

- rank: 1000+ posts

- Posts: 1921
- Joined: Tue Nov 17, 2009 10:11 pm
- Reputation: 726
- Gender:

- Contact:
I guess no questions yet. With that much experience, I will throw out my understanding to drawing them. The angle is always 90 degrees.
As price makes a higher high or higher low the 90 degree line moves up and down a scale to pinpoint direction change.
I dont expect this to make sense... I never finished the study with the guy that used them...but maybe with all your experience you know what i am referencing....
this is why it looks like a shrinking cone to me....but as you said... you have to learn how to draw them 1st... so my 1st step could be something completely different or wrong.
fingers crossed...
doji
- Attachments
-
- fwsv8h.png (35.42 KiB) Viewed 2809 times
It always takes Momentum to break Momentum!
"A small loss is just as satisfying as a large gain" -MO
"Sometimes we need to stop learning and start thinking...."
"Once you stack, you'll never go back!"
"A small loss is just as satisfying as a large gain" -MO
"Sometimes we need to stop learning and start thinking...."
"Once you stack, you'll never go back!"
-
dojirock
- rank: 1000+ posts
- Posts: 1921
- Joined: Tue Nov 17, 2009 10:11 pm
- Reputation: 726
- Gender:
- Contact:
I think my lines are jacked... lol
in some strange way they make sense to me, but how? I really dont know.
doji
in some strange way they make sense to me, but how? I really dont know.
doji
- Attachments
-
- 2014-07-15_2359.png (54.4 KiB) Viewed 2806 times
-
- 2014-07-15_2355.png (52.23 KiB) Viewed 2806 times
It always takes Momentum to break Momentum!
"A small loss is just as satisfying as a large gain" -MO
"Sometimes we need to stop learning and start thinking...."
"Once you stack, you'll never go back!"
"A small loss is just as satisfying as a large gain" -MO
"Sometimes we need to stop learning and start thinking...."
"Once you stack, you'll never go back!"
Please add www.kreslik.com to your ad blocker white list.
Thank you for your support.
Thank you for your support.
-
Jalarupa

- rank: 1000+ posts
- Posts: 1300
- Joined: Tue Feb 23, 2010 5:50 pm
- Reputation: 324
- Location: South Africa
- Gender:
Hi Doji,
If I may weigh in here... This "shrinking action" that you are referring to is the Pennant... and yes MO is right about having to throw out every textbook definition of what a triangle/cone and pennant is because NOONE I have come across draw them like he does and even the most experienced Technical traders marvel at the sight of them... because they defy all logic and reason of the cookie cutter connect the dots type of conventional technical analysis.
So where to begin?
Lets start with a ANGLE - any angle MO says he likes to tear them with his hands... so accuracy is not paramount because you are looking for the spirit of the PA - so is it making higher highs, lower lows, expanding, compacting - that sorta thing...
The nice thing is if you get this right then you can become very accurate at predicting future price points with greater accuracy and efficiency that what a horizontal line affords you - HOWEVER accuracy is not the purpose because we exclude breaks from the overall vision that we are trying to create.
So first you need to find the angles and test them out on a few areas...
Then you can create a Pennant... This is what a pennant looks like...
Then this is how a cone is made... See together they form a DOP (Diamond of Percenption)
and finally you can get creative and make a channel of both of them and wait and see how price behaves in the channels...
If you found this little demonstration useful then save these gifs because I do not know how long they will be hosted for...
But yeah this is how you do it... play around with them and you'll see some crazy stuff... Enjoi!

-
Jalarupa
- rank: 1000+ posts
- Posts: 1300
- Joined: Tue Feb 23, 2010 5:50 pm
- Reputation: 324
- Location: South Africa
- Gender:
Jalarupa wrote:Hi Doji,
If I may weigh in here... This "shrinking action" that you are referring to is the Pennant... and yes MO is right about having to throw out every textbook definition of what a triangle/cone and pennant is because NOONE I have come across draw them like he does and even the most experienced Technical traders marvel at the sight of them... because they defy all logic and reason of the cookie cutter connect the dots type of conventional technical analysis.
So where to begin?
Lets start with a ANGLE - any angle MO says he likes to tear them with his hands... so accuracy is not paramount because you are looking for the spirit of the PA - so is it making higher highs, lower lows, expanding, compacting - that sorta thing...
The nice thing is if you get this right then you can become very accurate at predicting future price points with greater accuracy and efficiency that what a horizontal line affords you - HOWEVER accuracy is not the purpose because we exclude breaks from the overall vision that we are trying to create.
So first you need to find the angles and test them out on a few areas...
Then you can create a Pennant... This is what a pennant looks like...
Then this is how a cone is made... See together they form a DOP (Diamond of Percenption)
and finally you can get creative and make a channel of both of them and wait and see how price behaves in the channels...
If you found this little demonstration useful then save these gifs because I do not know how long they will be hosted for...
But yeah this is how you do it... play around with them and you'll see some crazy stuff... Enjoi!
Word of warning... you probably wanna be sober before you read the above post...
-
Captain Pugwash

- rank: 500+ posts

- Posts: 529
- Joined: Wed Sep 14, 2011 7:59 am
- Reputation: 166
- Location: Insanitary Industries
- Gender:

Wow Jal - thats some serious effort you've put in there.
Thanks so much mate
saved as gifs - gong to request an upgrade to the clarify- it team so i can include gifs into my tutorial volumes
Jal - I noticed on the last gif you started making the lines thinner and "dashy" or "dotty" - whatever
Is this simply to declutter the chart - or is there some higher purpose?
"MOJO 1)Self-confidence, Self-assuredness. As in basis for belief in ones self in a situation. Esp/In context of contest or display of skill such as going into battle. 2)Ability to bounce back from a debilitating trauma and negative attitude YEH BABY
-
Jalarupa
- rank: 1000+ posts
- Posts: 1300
- Joined: Tue Feb 23, 2010 5:50 pm
- Reputation: 324
- Location: South Africa
- Gender:
POSSIBLE CONFUSING POST AHEAD
**proceed with caution**
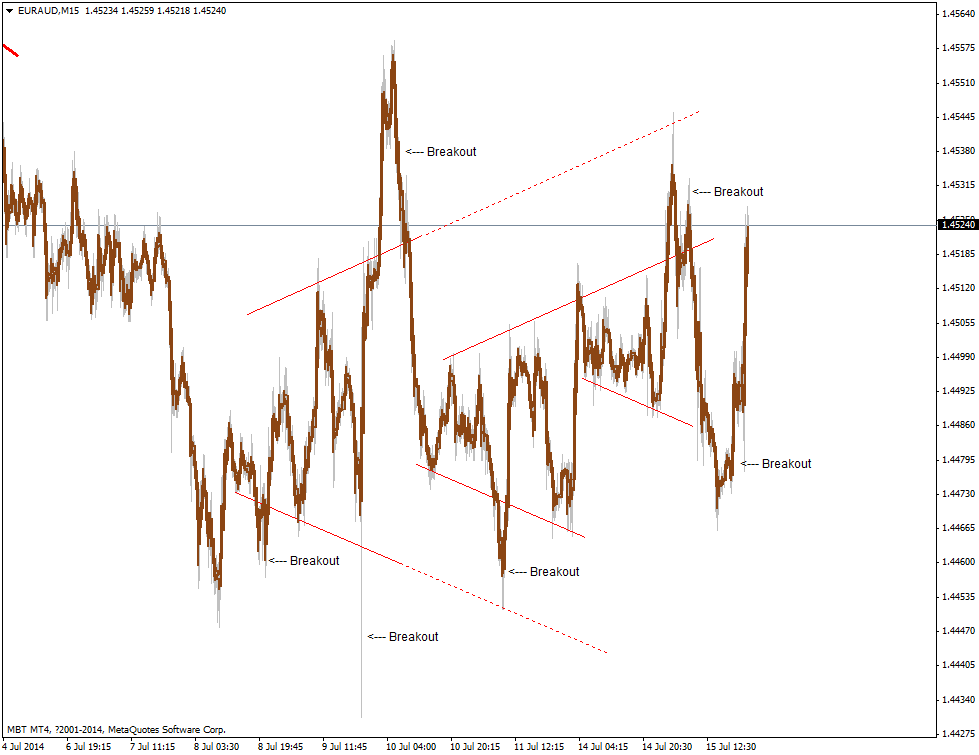
Here's some Observations...
This cone resistance crossed PA and became Pennant Support
1 moves to 2
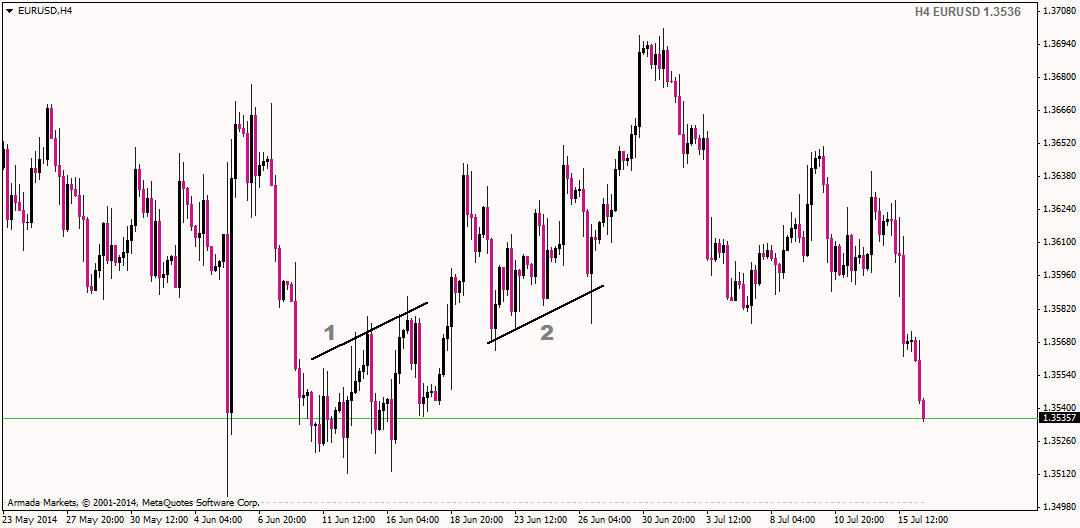
Next we see a narrow triangle pointing to the direction of the breakout... with hidden cone breakout support...

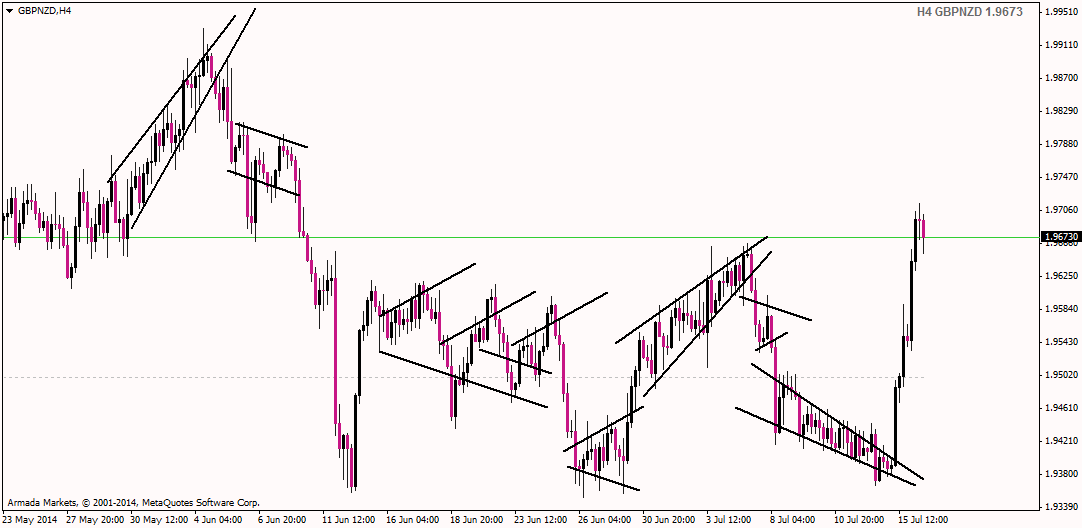
EDIT one more observation for good measure...
Although I don't completely understand much of it myself...
**proceed with caution**
Here's some Observations...
This cone resistance crossed PA and became Pennant Support
1 moves to 2
Next we see a narrow triangle pointing to the direction of the breakout... with hidden cone breakout support...
EDIT one more observation for good measure...
Although I don't completely understand much of it myself...
Please add www.kreslik.com to your ad blocker white list.
Thank you for your support.
Thank you for your support.