
Jalarupa wrote:tmanbone wrote:Jalarupa wrote:Slightly Simpler Model
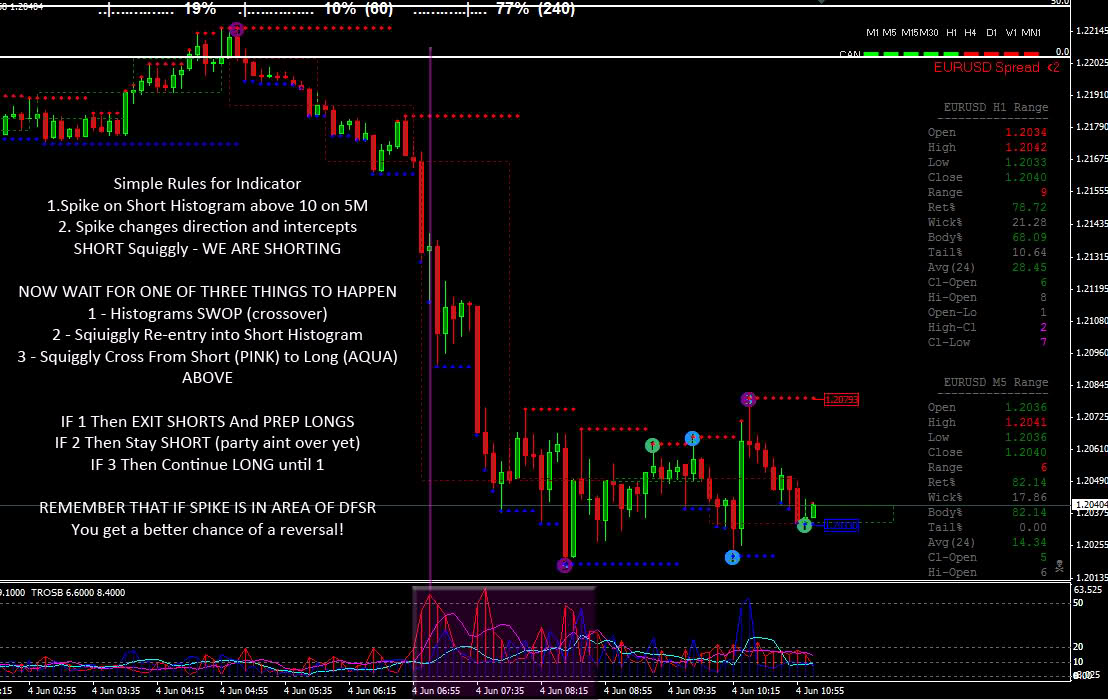
- This shows how the party started and how it ends and then becomes a whole new party all together...
Shows the Party effect (Spike) and the Hangover effect (Histogram crossovers) - the Party effect Squiggly Crossovers and the Hangover effect Histogram crossovers...
Hope this makes it a little easier to code... I really think this will work if we get it right... Great input Smoke! thx
Jalarupa, you've been studying hard. I find this system a bit confusing, but will dig in this weekend to get a grip. Thanks for breaking it down. Can you explain what you mean when you say short histogram? Are there two overlapping histograms, one short the other long? One blue the other red? Could you make us out a legend defining each part/line/bar of the indi? I'll study the entire thread this weekend; these are questions that pop to mind at first glance. Thanks again.
Sure thing...
Smoke can you check to see if I am on a similar page as you in my analysis?
I'm honest, if we can get this right then I feel sorry for the banks... Market DNA... Love that concept! Everything in life is cyclical and there is a natural flow of energies... We just need to unlock the secrets to that force and we will be able to plug right in!
Exciting!
If these triggers are used in conjunction with what we know from NLA and MO's teachings... I pitty the banks...
Signal Bender
Moderator: moderators
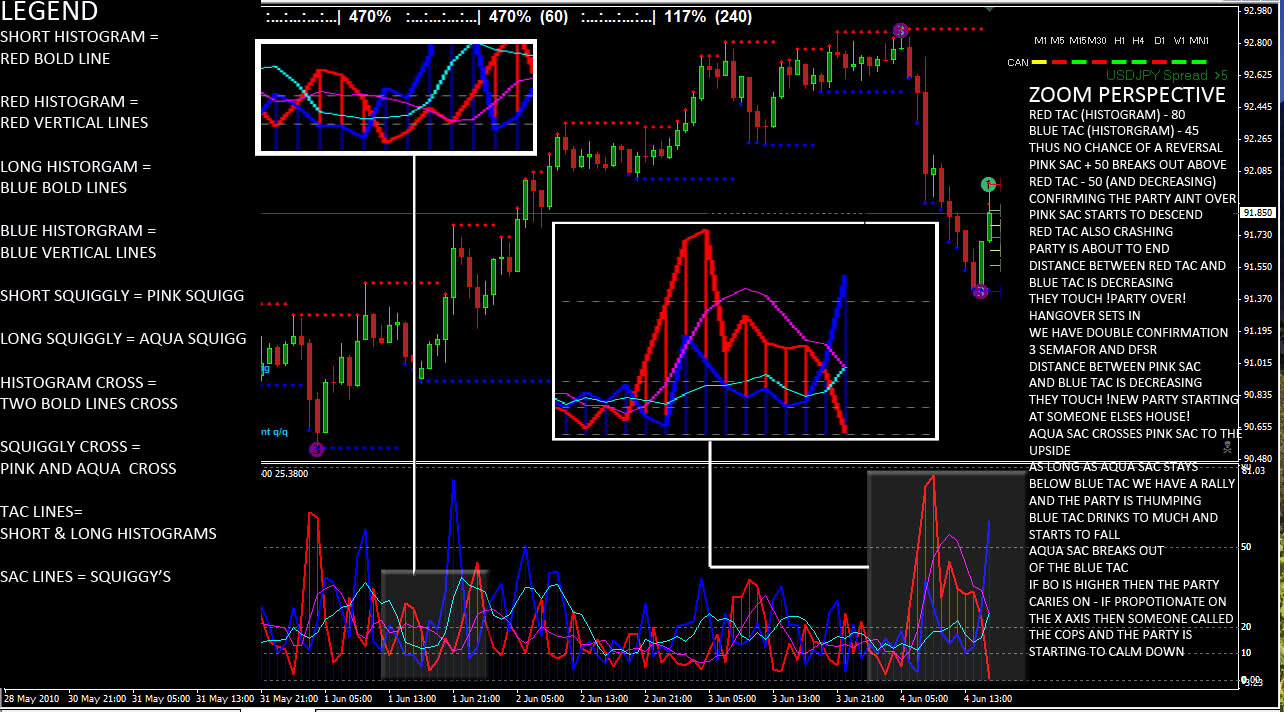
jalarupa, the zoom perspective that you came up with is awesome. What a great interpretation. TY
Price closed over a line that you believed to be support and that is the first indication that something is WRONG-MO
Please add www.kreslik.com to your ad blocker white list.
Thank you for your support.
Thank you for your support.
-
Jalarupa

- rank: 1000+ posts

- Posts: 1300
- Joined: Tue Feb 23, 2010 5:50 pm
- Reputation: 324
- Location: South Africa
- Gender:

ONE FOR THE GREEN RATS

Another Perspective for the BUY SIGNAL
(I have taken away the Short Histogram to display only the Long Spikes as well as the squiggly's)
From what I could see; Pink Squiggly makes a SPIKE and there is a SPIKE in the OPPOSITE DIRECTION by the AQUA Squiggly AS WELL AS a SPIKE by the BLUE TAC or Histogram in the same direction as AQUA... I'm looking at an area of 3 candles or (3 BLUE Histogram vertical bars) We have a BULLS PARTY en route! BUY BUY BUY!!!
You'll see the RED DOTTED Spikes marked where there is no correlation between the 2 or 3 deciding factors for a buy... HENCE NO BUY...
I hope this helps with coding
*EDIT* I also thought about having a level of 2.5 as a determining factor for the TAC Downward spike... Does it work?
-
Jalarupa
- rank: 1000+ posts
- Posts: 1300
- Joined: Tue Feb 23, 2010 5:50 pm
- Reputation: 324
- Location: South Africa
- Gender:
gfg1 wrote:jalarupa, the zoom perspective that you came up with is awesome. What a great interpretation. TYJalarupa wrote:tmanbone wrote:Jalarupa wrote:Slightly Simpler Model
- This shows how the party started and how it ends and then becomes a whole new party all together...
Shows the Party effect (Spike) and the Hangover effect (Histogram crossovers) - the Party effect Squiggly Crossovers and the Hangover effect Histogram crossovers...
Hope this makes it a little easier to code... I really think this will work if we get it right... Great input Smoke! thx
Jalarupa, you've been studying hard. I find this system a bit confusing, but will dig in this weekend to get a grip. Thanks for breaking it down. Can you explain what you mean when you say short histogram? Are there two overlapping histograms, one short the other long? One blue the other red? Could you make us out a legend defining each part/line/bar of the indi? I'll study the entire thread this weekend; these are questions that pop to mind at first glance. Thanks again.
Sure thing...
Smoke can you check to see if I am on a similar page as you in my analysis?
I'm honest, if we can get this right then I feel sorry for the banks... Market DNA... Love that concept! Everything in life is cyclical and there is a natural flow of energies... We just need to unlock the secrets to that force and we will be able to plug right in!
Exciting!
If these triggers are used in conjunction with what we know from NLA and MO's teachings... I pitty the banks...
Anytime g!
-
SmokyByers
- rank: <50 posts

- Posts: 16
- Joined: Wed Sep 12, 2007 5:03 pm
- Reputation: 0
- Location: Scottsdale
- Gender:

gfg1 wrote:Smoky, would you mind giving an example of this on a chart? TIA
Sorry, I'm more of a numbers guy, and never really learned MT4 fluently, so it would be quite a task for me to come up with this on a chart. I'm just trying to help simplify things. Instead of two lines for each side, you could combine them into one, this makes the rules easier.
Long TAC (histogram) divided by Long SAC (squiggly) equals a fill percentage. When one side (long or short) has an extreme fill and the other side is underfilled, then look for a reversal in the near future. The beautiful thing about using the EWMA is that it sort of self adjusts for trends, so extreme histogram lines don't seem so extreme when in a trend and can avoid false signals.
Smoke
Re: ONE FOR THE GREEN RATS
So basically in this scenario, you do not even need the histogram, correct? Nice work jalarupa.
Jalarupa wrote:
Another Perspective for the BUY SIGNAL
(I have taken away the Short Histogram to display only the Long Spikes as well as the squiggly's)
From what I could see; Pink Squiggly makes a SPIKE and there is a SPIKE in the OPPOSITE DIRECTION by the AQUA Squiggly AS WELL AS a SPIKE by the BLUE TAC or Histogram in the same direction as AQUA... I'm looking at an area of 3 candles or (3 BLUE Histogram vertical bars) We have a BULLS PARTY en route! BUY BUY BUY!!!
You'll see the RED DOTTED Spikes marked where there is no correlation between the 2 or 3 deciding factors for a buy... HENCE NO BUY...
I hope this helps with coding
*EDIT* I also thought about having a level of 2.5 as a determining factor for the TAC Downward spike... Does it work?
Price closed over a line that you believed to be support and that is the first indication that something is WRONG-MO
Please add www.kreslik.com to your ad blocker white list.
Thank you for your support.
Thank you for your support.
Smoke, sorry just meant on a drawing, but your explanation is more than adequate. ty
SmokyByers wrote:gfg1 wrote:Smoky, would you mind giving an example of this on a chart? TIA
Sorry, I'm more of a numbers guy, and never really learned MT4 fluently, so it would be quite a task for me to come up with this on a chart. I'm just trying to help simplify things. Instead of two lines for each side, you could combine them into one, this makes the rules easier.
Long TAC (histogram) divided by Long SAC (squiggly) equals a fill percentage. When one side (long or short) has an extreme fill and the other side is underfilled, then look for a reversal in the near future. The beautiful thing about using the EWMA is that it sort of self adjusts for trends, so extreme histogram lines don't seem so extreme when in a trend and can avoid false signals.
Smoke
Price closed over a line that you believed to be support and that is the first indication that something is WRONG-MO
-
SmokyByers
- rank: <50 posts
- Posts: 16
- Joined: Wed Sep 12, 2007 5:03 pm
- Reputation: 0
- Location: Scottsdale
- Gender:
-
Jalarupa
- rank: 1000+ posts
- Posts: 1300
- Joined: Tue Feb 23, 2010 5:50 pm
- Reputation: 324
- Location: South Africa
- Gender:
Re: ONE FOR THE GREEN RATS
gfg1 wrote:So basically in this scenario, you do not even need the histogram, correct? Nice work jalarupa.Jalarupa wrote:
Another Perspective for the BUY SIGNAL
(I have taken away the Short Histogram to display only the Long Spikes as well as the squiggly's)
From what I could see; Pink Squiggly makes a SPIKE and there is a SPIKE in the OPPOSITE DIRECTION by the AQUA Squiggly AS WELL AS a SPIKE by the BLUE TAC or Histogram in the same direction as AQUA... I'm looking at an area of 3 candles or (3 BLUE Histogram vertical bars) We have a BULLS PARTY en route! BUY BUY BUY!!!
You'll see the RED DOTTED Spikes marked where there is no correlation between the 2 or 3 deciding factors for a buy... HENCE NO BUY...
I hope this helps with coding
*EDIT* I also thought about having a level of 2.5 as a determining factor for the TAC Downward spike... Does it work?
Just picked another signal!
When the aqua squiggly is in an upward trajectory and crosses the Blue Histogram (also in an upward trajectory) its a BUY BUY BUY!!!!
And if the aqua is in a downward trajectory (below the pink squiggly) THEN ITS SELL SELL SELL!!!
*EDIT* you don't need the histograms if you got the squiggly's
-
Jalarupa
- rank: 1000+ posts
- Posts: 1300
- Joined: Tue Feb 23, 2010 5:50 pm
- Reputation: 324
- Location: South Africa
- Gender:
altima wrote:Hi Guys,
First time posting a pic apologies if it comes out wrong.
In a quick view of this it does look like it may have some merit. Thanks to SignalBender and TRO for the original work and Jalarupa for deciphering some of it. I was having trouble seeing things with all those lines everywhere so I split the indicator into two seperate windows. Top indi is the sell histogram (bar) with the buy squiggly and buy (line) histogram laid on top of it. The bottom window is the buy histogram with the sell squiggly and sell (line) laid on top of it. It makes it clearer for me, though I should put the buy window above the sell. lol
All I'm looking at is when the bar pops above the 2 lines you have a signal to go long or short. Top window- Red bar (sell histogram) above the 2 aqua lines (buy squiggly and buy line) you have a sell signal. Opposite obviously for a buy on the other indicator window. So that you don't get whipsawed, I'm looking at it and thinking that maybe 2 red bars above the line in a row gives a sell, one green bar above the line after gives a close signal for that sell but direction is still down. Wait for a 2nd green bar for a buy, if it doesn't come and another red bar shows up we're going down again.
You can see in the pic it would have got you about 300 pips on the eur/jpy move on Friday. Any critique or new ideas are welcome, lets see if we can make something of this.
WOW altima we thinking along the same lines...
What you are demonstrating so nicely there is a Histogram Cross... Immediate Buy & Sell Signal, It works well with strong momo... very nice and well spotted!

Okay so please could you confirm something for me... I've discovered a Zline Entry confirmation... I know its a bit fuzzy atm, but what I have done is create a BUY and a SELL version of the indicator and I have marked with white dots where the EMA SAC Squiggly is moving in a upward trajectory AND then we get an opposing force (pullback) in the form a HISTOGRAM VERTICAL LINE - coming within a tight range of the opposing squiggly (in most cases touching & then moving in the opposite direction - for true Zline entry confirmation) If you enter in the direction of the Squiggly via limit order (at Zline or nearest) you can get a confirmation that your entry was good...Keep watching the EMA... as long as it is moving UPWARDS... you are rocking the PARTY! When it starts to calm downwards MOMO is slowing down and there is a high probablility of a Zline entry in the opposite direction when you get a Bullish EMA confirmation followed by a histogram touching your Bullish EMA...
Also note that when the BOLD EMA's SAC SQUIGGLY'S CROSS THE BOLD TAC HISTOGRAMS WE HAVE ANOTHER REALLY CREDIBLE BUY / SELL SIGNAL AS LONG AS THE TRAJECTORY IS UPWARDS (I have noted that below 3 on the indicator is a good level for reference of this cross)
TRO, what u think? I foresee banks being drained...
Please add www.kreslik.com to your ad blocker white list.
Thank you for your support.
Thank you for your support.