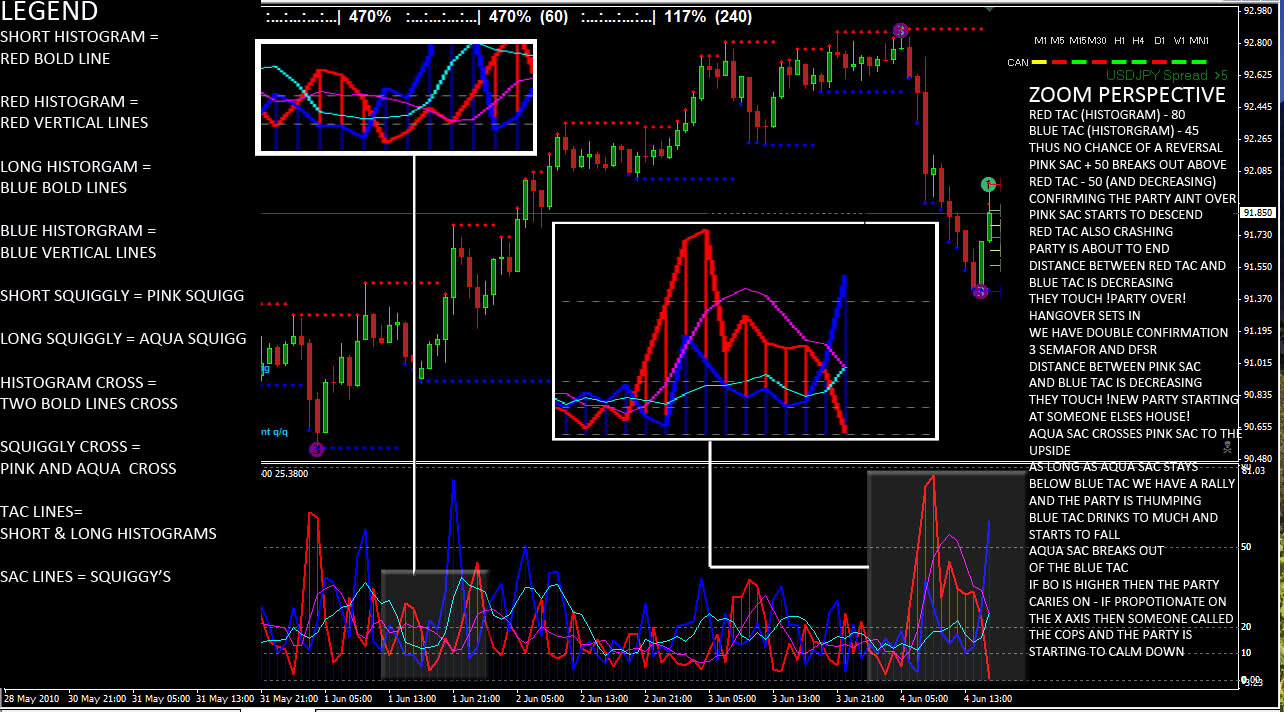
- This shows how the party started and how it ends and then becomes a whole new party all together...
Shows the Party effect (Spike) and the Hangover effect (Histogram crossovers) - the Party effect Squiggly Crossovers and the Hangover effect Histogram crossovers...
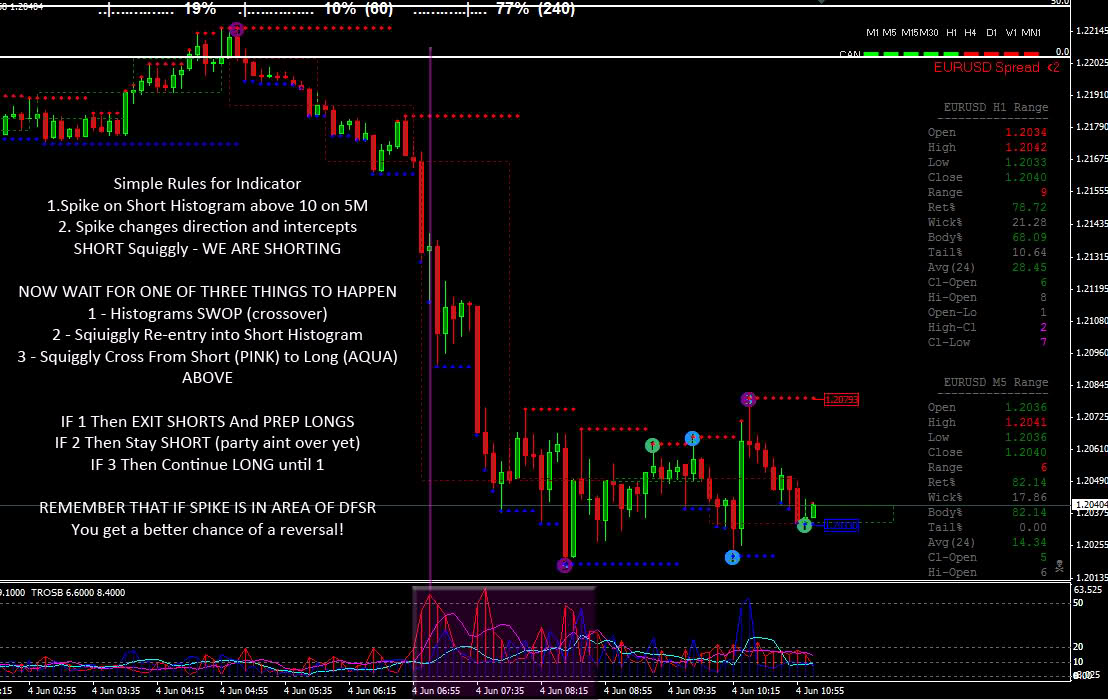
Hope this makes it a little easier to code... I really think this will work if we get it right... Great input Smoke! thx