TheRumpledOne wrote:Jalarupa:
If you will post the entry logic, I can program it into the indicator. So we would have a buy/short/wait indicator.
Okay here goes... for now I'm only using M5 CHARTS
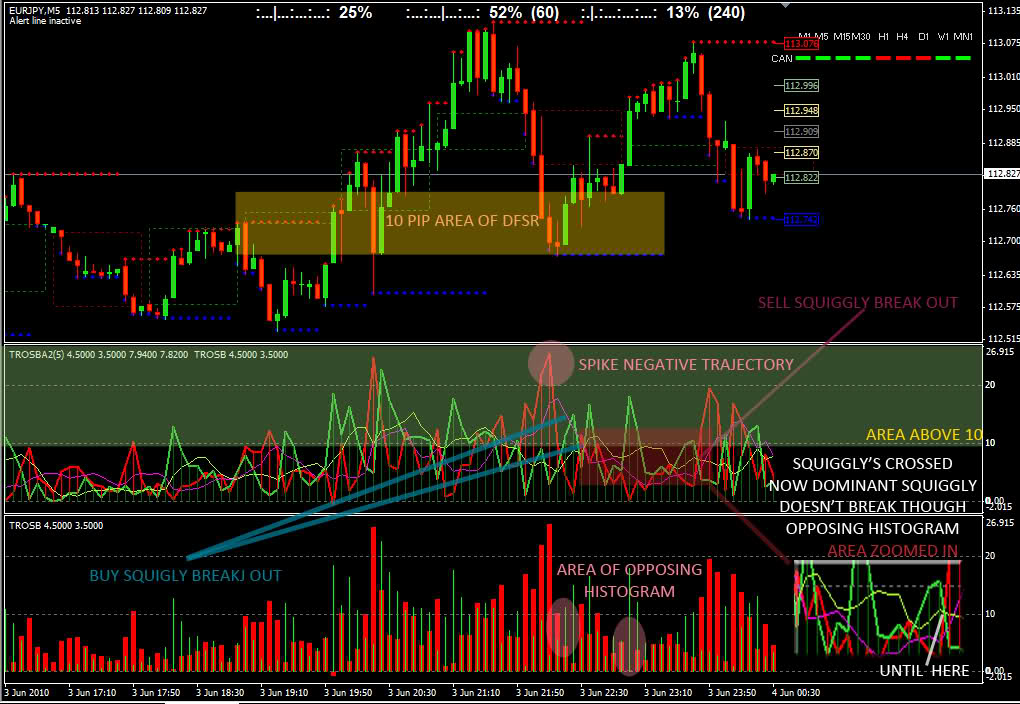
BUY Histogram = Bullish Moves
SELL Histogram = Bearish Moves
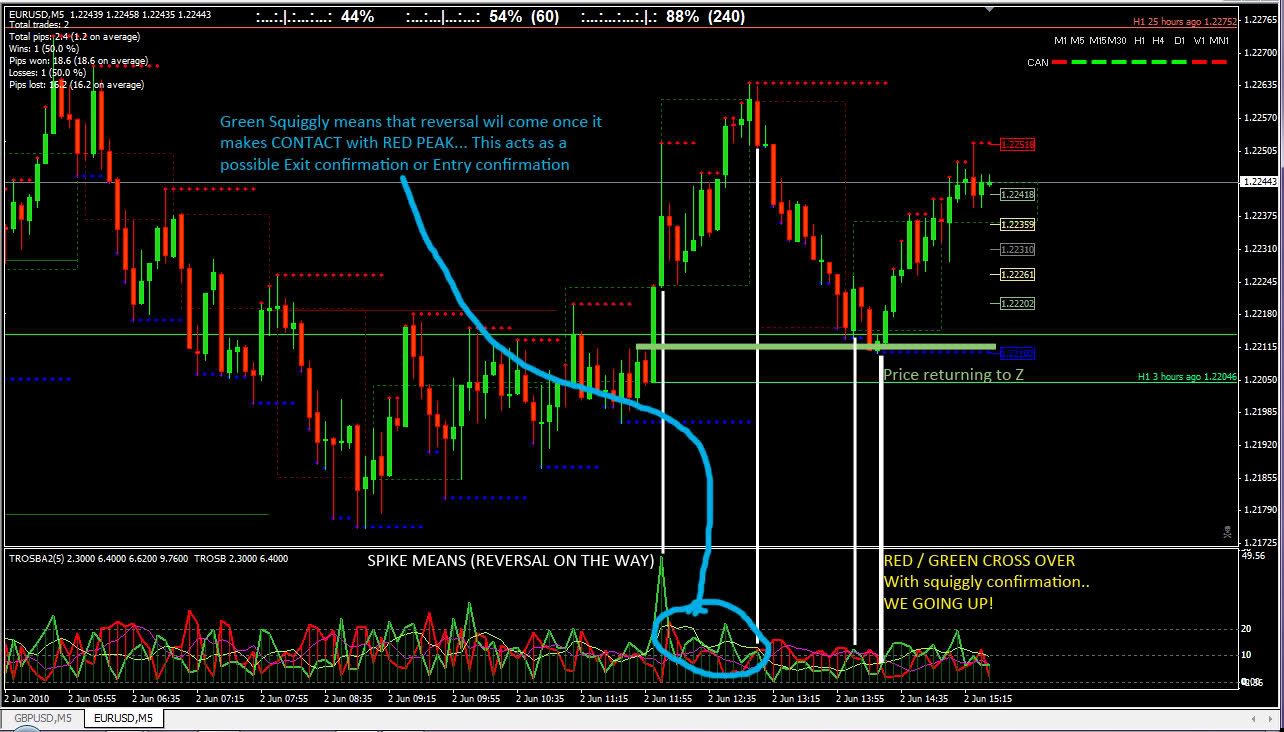
Buy Squiggly = Line Close outside of Sell Histogram
Sell Squiggly = Line Close outside of Buy Histogram
Spike = Any move by Histogram at or above 10 Which stops and begins a negative trajectory (Closing on this negative trajectory in the area of opposing histogram)
IF:
Spike is in the area (10 pips) of previous DFSR dots (4 or more consecutive dots)
Then:
Probability of reversal is 50%+
When:
Probability is 50%+ (or the above is true)
Then IF:
Buy or Sell Squiggly HAS BROKEN OUT OF HISTOGRAM
Then:
Probability is 75% of a trade in the direction of histogram ending in success
IF:
Squiggly's both cross and the new dominant squiggly doesn't break though the opposing histogram we have a winner.
This happens and histograms do not engulf one another the probability of continued movement in direction of profit is 100%
When:
Histograms Closing on its negative trajectory in the area of opposing histogram
Then:
Prepare to exit trade
Apologies if it doesn't make sense... I had to rush to get it done before work... TGIF!