I know how to draw those zones like that, using opposing candles that close over their previous extremes to create turning points.
I'd only mark them when price creates a new low or high, until they break. Not to mark everything in between and get completely lost.
I guess it's a mix between something from doji and this quote from H. Rearden that I read through TRO:
"Now, 2 patterns of market behavior happen on a regular basis:
1) the price breaks to new high's (or low's)
2) the price reverses from new high's (or low's)
They happen regardless of time frame (with the obvious limitations explained above)
They are phenomena that can be exploited without the fear if found out by others, that they might cease to exist."
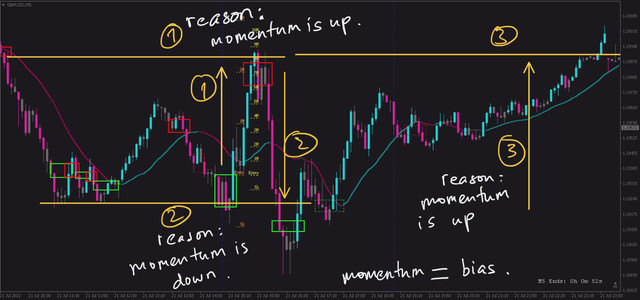
So taking the example from today this is how I would look at the session.
- GU_07222022_Context.png (205 KiB) Viewed 1614 times
In hindsight I can see they are zones of very little risk and one could trade from one zone to another. Even the last 'bearish zone' at the end would have small risk when price came back to it. But on regards to bias I'd be completely all over the place, there's so many things I could give me a 'bias' reason.
This is how I see the chart:
I see the first short momentum at the left. I'd consider that run as strong. That created a bearish zone which held. I guess the bias, considering the zone and momentum, is short.
Then momentum ended and there was another zone at the bottom, but it didn't have as much strength as the short momentum. So that's another zone and price is reversing, but bias is still short I suppose.
Then price goes up, then down, then up again between the zones.
But then the bearish zone, which was backed by the stronger momentum, broke. And now I have the largest momentum I can see on the chart, which is now bullish. So my bias is now bullish?
Then I see that maybe price will turn, but it doesn't, until it finally does, but with weaker momentum if I compare it to the bullish momentum.
So is my bias still long? Is there any way I could use this in conjunction with the SMA? Because if I take the first two zones, the SMA is pointing at the other side, so there's a conflict of bias.
---
Maybe my mind would be at ease if I could say "now bias is long, now bias is short". At first the idea would be to use the SMA, but how can I use the overall context of the chart in conjunction with the SMA?
I know context is really important and another wall I need to break to progress.
(If this chart reading is way off, please let me know)