PA, S/R, ZL, EXTREMES & MOMO
Moderator: moderators


Please add www.kreslik.com to your ad blocker white list.
Thank you for your support.
Thank you for your support.

jarnapal wrote:What do you look when you draw these s/r lines ? I keep drawing then at wrong places
Hi jarnapal,
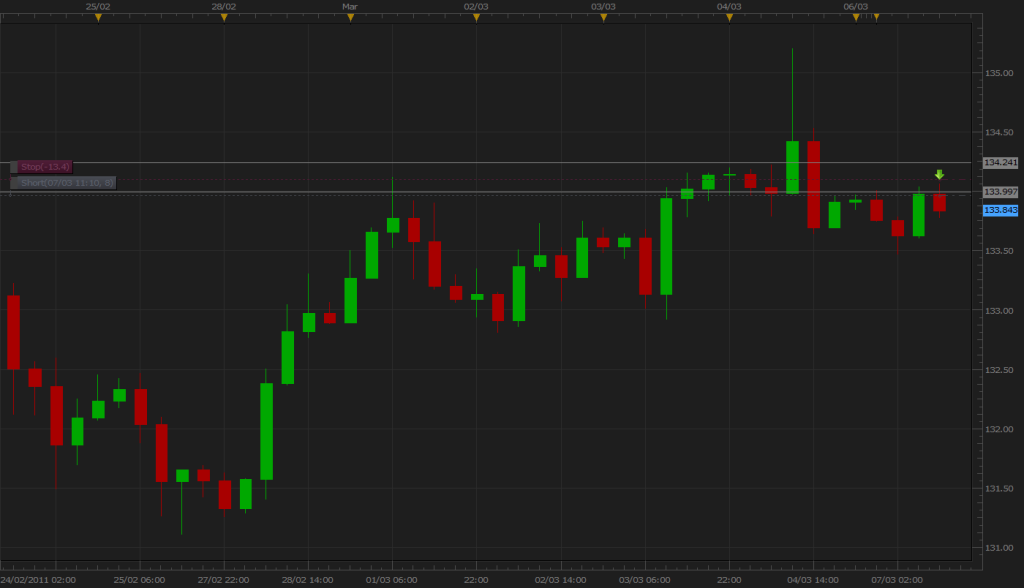
what I do is starting with the most obvious ones - I draw lines at the extremes (this is no-brainer).
Later I look for areas where price may find support or resistance. Something like this:

After finding those areas I would look for places within those areas which may serve as basis for lines. Possibilities are countless. You can use swing extremes, closing prices, wicks, ZL, etc.

Lots of them, isn't it?
So let's get to the point.
In my opinion it doesn't really matter where the line is precisely. I use them only as the indication and a reminder that somewhere there is a supply / demand area.
Pay close attention to lines adjacent to each other. Does it really matter which you choose? No. Results would be more or less the same.
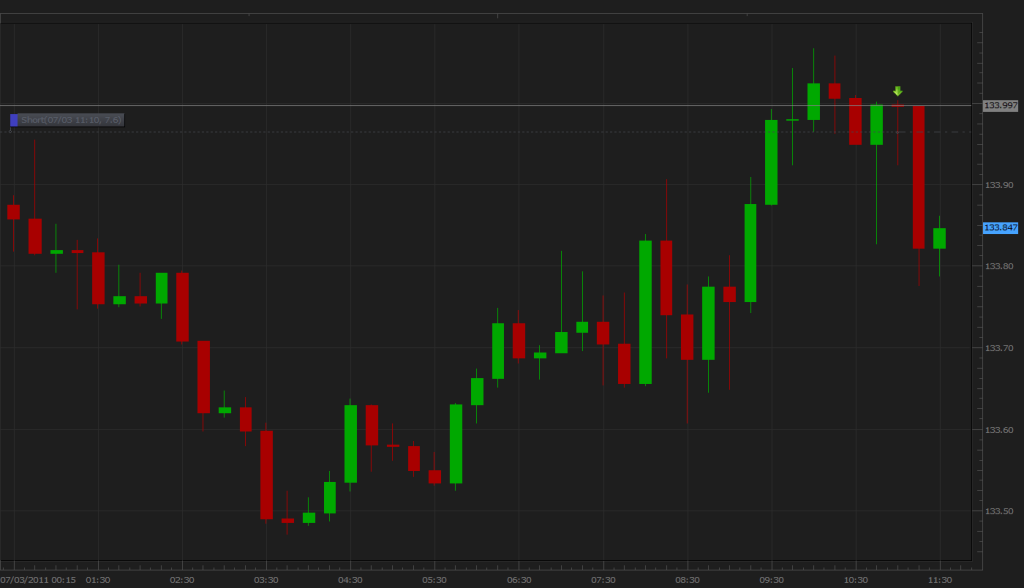
Nevertheless I have some personal favorites:

- recent extremes (blue, red)
- fat cats (red)
- swing highs/lows (either wicks or closing prices) within the mighty zone of the following momo candles (orange, green)
- swing highs/lows (either wicks or closing prices) that after being broken served as the support/resistance for the retracing price (black, green)
- extremes that might potentially be a part of head and shoulders pattern (magenta)
That's the way I look at the charts. Hope that it helps somehow


-
newscalper

- rank: 1000+ posts

- Posts: 1068
- Joined: Tue Oct 19, 2010 5:58 pm
- Reputation: 7
- Gender:

Please add www.kreslik.com to your ad blocker white list.
Thank you for your support.
Thank you for your support.


Please add www.kreslik.com to your ad blocker white list.
Thank you for your support.
Thank you for your support.