bredin wrote:Rob, I am using II_CC_3x on that chart, which plots all three CC's at once, and the underlying chart is set to the background color (I think its a line chart). II_CC_3x is a donational indi, but can be replicated by using 3 different II_CC_Lite indis with different object.layer values.
It sounds like newscalper has it sorted if you have some trouble.
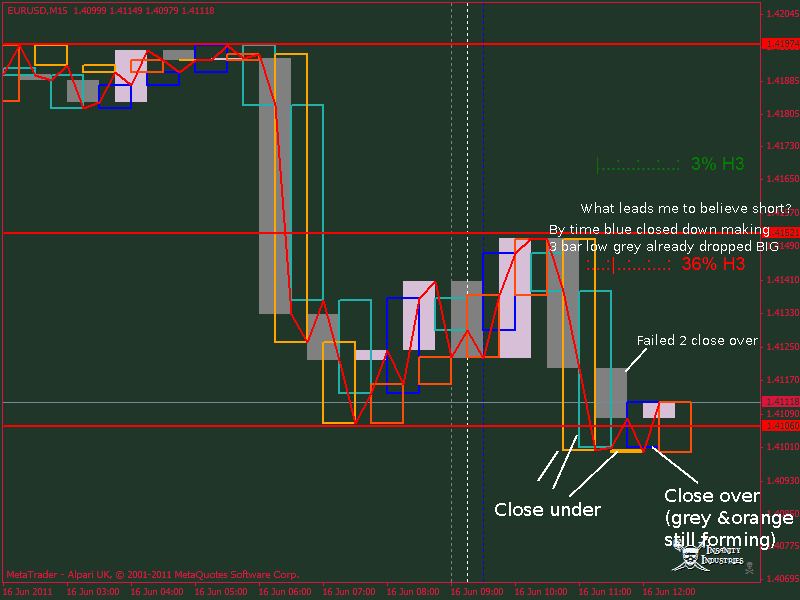
newscalper, who says I didnt get faked

but the answer to "what do I do about it?" comes quickly: I dump and wait for the price to close over either the dark blue or the brown, but one could have taken a risk on a stop-and-reverse depending on how aggressive you wanted to be.
MO talked about there being a leading CC and an entry CC. I cant recall which thread that concept in in though

G.
Ta for the reply bredin, I've got the CC_Lite going on but I dont seem to get the vertical spacing / wick representation that your donational one has, which looks like the most valuable function in discerning fakeouts etc, was wondering if it was to do with 'find extreme' settings, I've played with them a bit, but maybe need to a bit more...

You are absolutely right about what to do about what to do about getting faked (dumping and waiting), something I'm still trying to get into my thick head.. this forum has been an treasure trove of info but it cant teach you to learn your own psychology...
newscalper: thanks for the template, if it makes you feel any better I just dumped a large chunk of my profits on that same piggy slaughter place that you did a few days ago... not best pleased cos I thought I'd 'got it figured'...
after that I was in the massive GU short @ 1.642 on Tuesday, but was so freaked out by my loss that I didn't have the bottle to hold it, if I had would be even again now... I cant count how many times I've bailed and its come back to my old position and more quite rapidly... I guess the only way you learn the psychology / timing is to keep trading and not wipe out!
Cheers chaps, all the best