PA, S/R, ZL, EXTREMES & MOMO
Moderator: moderators


Please add www.kreslik.com to your ad blocker white list.
Thank you for your support.
Thank you for your support.

-
newscalper

- rank: 1000+ posts

- Posts: 1068
- Joined: Tue Oct 19, 2010 5:58 pm
- Reputation: 7
- Gender:

ES - could you comment on this please. It might help some who are struggling with this. I have to admit that sometimes I do too with price not coming to my area or seeing PA on the small TF that agrees with my analysis on the larger but then still blows through. Imagine this is a larger timeframe chart, I know this is 1m so it's crazy but you get the picture, there are very often multiple lines/areas within a momo breakout where price may come back to and then continue:
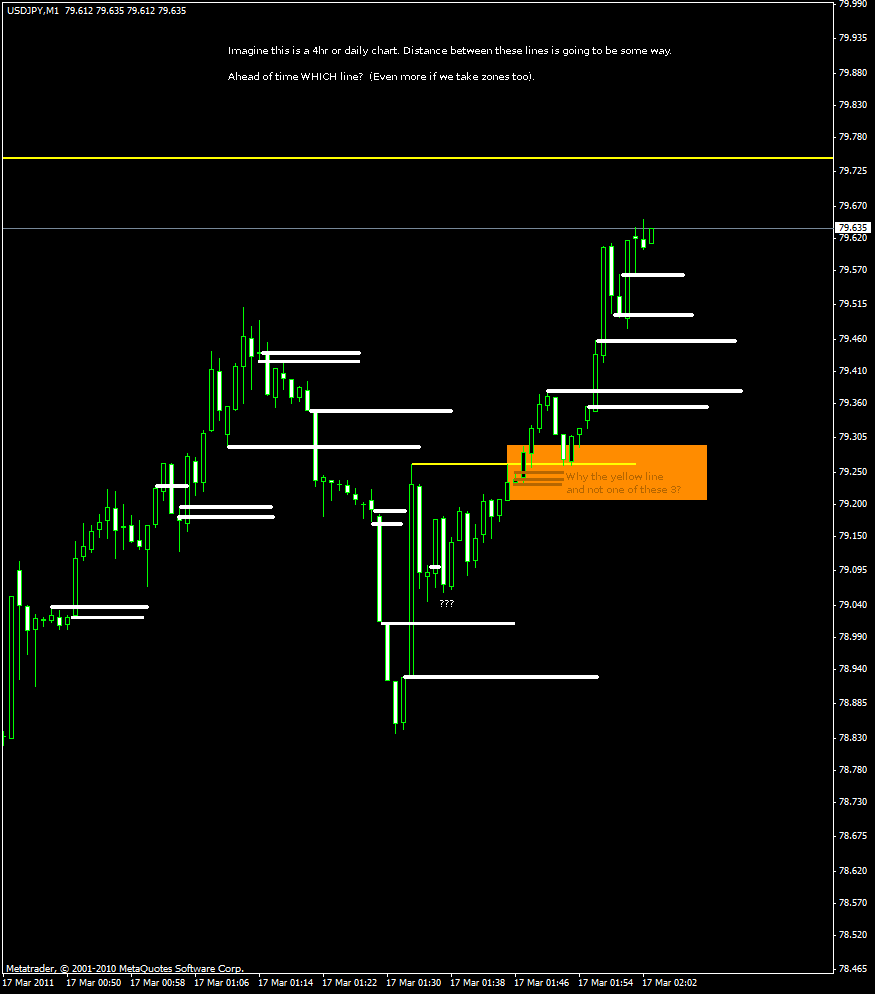
There's even more lines than I've added if close under/close over is included.
I know why the yellow line - because that's where price turned. But the thing is, depending how far left you look ahead of time, you can draw a line practically anywhere. Also if we a re supply/demand traders (like Seiden) the breakout on the lower timeframe chart would have been at one of the lower three lines, we would never have seen an entry - this is what happens to me a LOT).
Last edited by newscalper on Thu Mar 17, 2011 9:53 am, edited 1 time in total.
Please add www.kreslik.com to your ad blocker white list.
Thank you for your support.
Thank you for your support.
newscalper wrote:ES - could you comment on this please. It might help some who are struggling with this. I have to admit that sometimes I do too with price not coming to my area or seeing PA on the small TF that agrees with my analysis on the larger but then still blows through. Imagine this is a larger timeframe chart, I know this is 1m so it's crazy but you get the picture, there are very often multiple lines/areas within a momo breakout where price may come back to and then continue:
There's even more lines than I've added if close under/close over is included.
I know why the yellow line - because that's where price turned. But the thing is, depending how far left you look ahead of time, you can draw a line practically anywhere. Also if we a re supply/demand traders (like Seiden) the breakout on the lower timeframe chart would have been at one of the lower three lines, we would never have seen an entry - this is what happens to me a LOT).
the yellow line is resistance and it might be support in that area. Where you drew those lines is fine also.
The point is that you have no idea where price dip too, and thats why you draw a range of lines and watch it on the lower TF and enter when it looks like its supported in those areas.
maybe es/pip can comment more.

Please add www.kreslik.com to your ad blocker white list.
Thank you for your support.
Thank you for your support.