P&F charts suck, don't use them...

free & uncensored discussion arena for TheRumpledOne

Moderator: moderators

zhaozilong
rank: 50+ posts
rank: 50+ posts
Posts: 50
Joined: Sat Jun 25, 2011 11:25 am
Reputation: 0
Gender: None specified

My answer

Postby zhaozilong » Tue Oct 04, 2011 7:37 am

PebbleTrader wrote:Homework Assignment for zhao (no one else is allowed to answer)

Your options to choose from are:
-SUPPLY
-DEMAND
-POINT OF CONTROL (I know you know this one)
-MINOR ACCUMULATION
-DISTRIBUTION

Image

A = ?
B = ?
Z = ?
X = ?

zhao, we promise we won't laugh if you guess wrong.
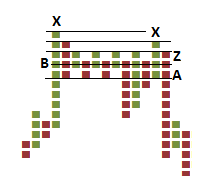
 :lol:


A = Distribution
B = Point of Control
Z = Supply
X = Demand

Many thanks.

-zhao

Please add www.kreslik.com to your ad blocker white list.
Thank you for your support.

User avatar
bredin
rank: 1000+ posts
rank: 1000+ posts
Posts: 1033
Joined: Mon Feb 16, 2009 10:41 pm
Reputation: 7
Gender: None specified
Contact:

Postby bredin » Tue Oct 04, 2011 7:40 am

Image

point made ??

G.
Welcome to the era of "Guns and Maskies" Trading!
The previous message contains discretion. Viewer nudity is advised.
Insanity Industries Indicators Here
Insanity Industries on YouTube!

zhaozilong
rank: 50+ posts
rank: 50+ posts
Posts: 50
Joined: Sat Jun 25, 2011 11:25 am
Reputation: 0
Gender: None specified

Postby zhaozilong » Tue Oct 04, 2011 7:44 am

bredin wrote:
zhaozilong wrote:
bredin wrote:Exactly Like Seiden, no different to any other S/D method.

I have not used the II_SupDem indicator in a very long time

Perhaps you could check it out, I'd hate to do too much work :)

G.


Hello Bredin or anyone,

is it possible to post a chart showing supply/demand zones for a PnF chart? not sure how to spot such zones in a PnF chart.

thanks.

-zhao


The same rules apply as with timed candles.

heres a markup of AU 10x2

Image

see how its the same as normal??

G.


many thanks, Bredin.
I usually trade using standard PnF patterns if i use PnF charts. something new for me to think.

best regards.

-zhao

User avatar
PebbleTrader
rank: 1000+ posts
rank: 1000+ posts
Posts: 1633
Joined: Fri Nov 12, 2010 2:15 am
Reputation: 15
Gender: Male

Postby PebbleTrader » Tue Oct 04, 2011 8:07 am

"A = Distribution
B = Point of Control
Z = Supply
X = Demand

Many thanks.

-zhao"

zhao, Not the answers I was looking for. Think in terms of the horizontal lines that are by each marked letter.

The X's being the upper most price level = ?

The Z line which is just above the point of control which is marking all that congested area = ?
Life is just a journey

zhaozilong
rank: 50+ posts
rank: 50+ posts
Posts: 50
Joined: Sat Jun 25, 2011 11:25 am
Reputation: 0
Gender: None specified

PnF Webniars from FXstreet

Postby zhaozilong » Tue Oct 04, 2011 8:12 am

hello all,

here is a nice introduction to PnF from FXstreet.


1 X Box Chart

PnF Multiple Box Reversals

PnF Basic Signals

Interview with Jeremy Du Plessis

Please add www.kreslik.com to your ad blocker white list.
Thank you for your support.

User avatar
PebbleTrader
rank: 1000+ posts
rank: 1000+ posts
Posts: 1633
Joined: Fri Nov 12, 2010 2:15 am
Reputation: 15
Gender: Male

Postby PebbleTrader » Tue Oct 04, 2011 8:15 am

One more clue,

DEMAND is NOT one of the answers :)
Life is just a journey

User avatar
PebbleTrader
rank: 1000+ posts
rank: 1000+ posts
Posts: 1633
Joined: Fri Nov 12, 2010 2:15 am
Reputation: 15
Gender: Male

Postby PebbleTrader » Tue Oct 04, 2011 8:17 am

Thanks for the links :)
Life is just a journey

User avatar
PebbleTrader
rank: 1000+ posts
rank: 1000+ posts
Posts: 1633
Joined: Fri Nov 12, 2010 2:15 am
Reputation: 15
Gender: Male

Postby PebbleTrader » Tue Oct 04, 2011 8:20 am

Life is just a journey

zhaozilong
rank: 50+ posts
rank: 50+ posts
Posts: 50
Joined: Sat Jun 25, 2011 11:25 am
Reputation: 0
Gender: None specified

Postby zhaozilong » Tue Oct 04, 2011 8:27 am

PebbleTrader wrote:"A = Distribution
B = Point of Control
Z = Supply
X = Demand

Many thanks.

-zhao"

zhao, Not the answers I was looking for. Think in terms of the horizontal lines that are by each marked letter.

The X's being the upper most price level = ?

The Z line which is just above the point of control which is marking all that congested area = ?


Hello PebbleTrader,

A =Distribution
X = Supply
Z = minor accumulation?

thanks.

-zhao

User avatar
PebbleTrader
rank: 1000+ posts
rank: 1000+ posts
Posts: 1633
Joined: Fri Nov 12, 2010 2:15 am
Reputation: 15
Gender: Male

Postby PebbleTrader » Tue Oct 04, 2011 8:41 am

Those answers look better :)

Think of the A-Z area all as being distribution.
Life is just a journey

Please add www.kreslik.com to your ad blocker white list.
Thank you for your support.


Return to “TheRumpledOne”