"So everytime an up candle closes above previous two or more up candles you have established long break-out and support just below the long breakout."
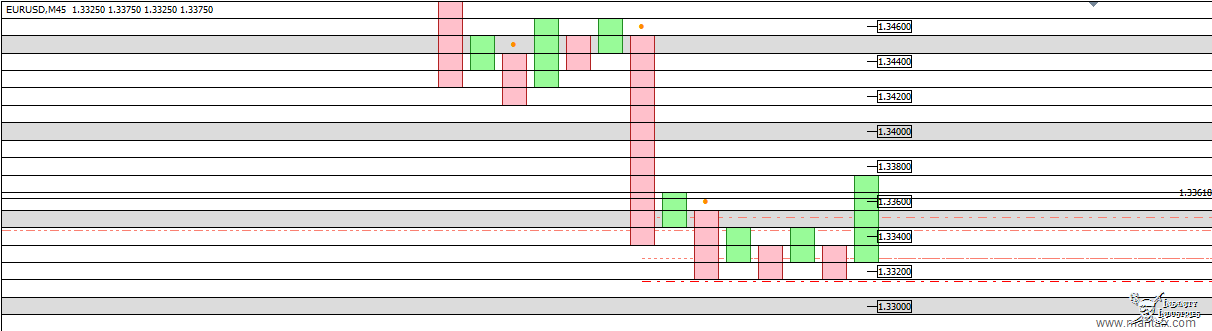
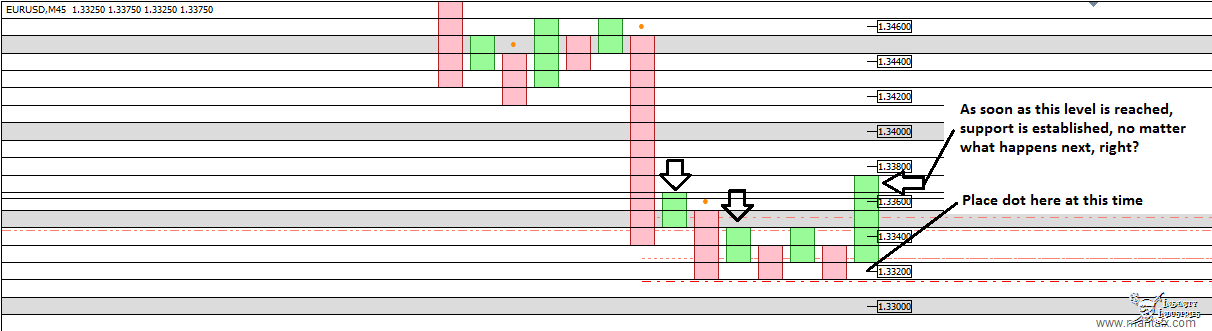
Ok, so the dot doesn't form until after the current column moves above the previous two up columns? Support dot does not form on a reversal from red column to green column then.
Thanks for clarification and sharing the indi
P&F charts suck, don't use them...
Moderator: moderators
- PebbleTrader
- rank: 1000+ posts
- Posts: 1633
- Joined: Fri Nov 12, 2010 2:15 am
- Reputation: 15
- Gender:
Please add www.kreslik.com to your ad blocker white list.
Thank you for your support.
-
- rank: 50+ posts
- Posts: 50
- Joined: Sat Jun 25, 2011 11:25 am
- Reputation: 0
- Gender:
PebbleTrader wrote:"POC is a Market profile term and i learn about it for PnF from a webniar here"
Can you share the gest of the idea?
Hello PebbleTrader,
do you mean the concept of POC or how to identify POC using PnF?
For POC, you can do a search of market profile, for identifying POC using PnF, do look at the webinar link in my post.
best regards.
- PebbleTrader
- rank: 1000+ posts
- Posts: 1633
- Joined: Fri Nov 12, 2010 2:15 am
- Reputation: 15
- Gender:
A bit of discretion to draw, but look at the orange freq dist, what I was looking for was a "plateau" and then where it falls off the plateau and into the "valley" or a "sandwich" of small bar sandwiched between two long bars...
Keep in mind these stats are over more PnF chart than you can see in the image.
For supply / demand, maybe we want to see the levels sandwiched like that, red bar surrounded by a green bar on each side?
Keep in mind these stats are over more PnF chart than you can see in the image.
For supply / demand, maybe we want to see the levels sandwiched like that, red bar surrounded by a green bar on each side?
Life is just a journey
- PebbleTrader
- rank: 1000+ posts
- Posts: 1633
- Joined: Fri Nov 12, 2010 2:15 am
- Reputation: 15
- Gender:
Just got to it,
Point Of Control is where most of the trading takes place, just like looking at the peaks of a freq dist. , or he used "bell shaped curve" in webinar. But price distribution are not normally distributed.
Look for buy or sell signals as price moves away from a POC area.
Point Of Control is where most of the trading takes place, just like looking at the peaks of a freq dist. , or he used "bell shaped curve" in webinar. But price distribution are not normally distributed.
Look for buy or sell signals as price moves away from a POC area.
Life is just a journey
-
- rank: 50+ posts
- Posts: 50
- Joined: Sat Jun 25, 2011 11:25 am
- Reputation: 0
- Gender:
PebbleTrader wrote:Just got to it,
Point Of Control is where most of the trading takes place, just like looking at the peaks of a freq dist. , or he used "bell shaped curve" in webinar. But price distribution are not normally distributed.
Look for buy or sell signals as price moves away from a POC area.
Hello PebbleTrader,
you are correct, i think your charts seem to be capturing the number of XOs in a row. i was hoping Bredin's indicator can also do it, it is good if it can also detect the patterns in PnF and to detect false auctions like in the webinar.
best regards
Please add www.kreslik.com to your ad blocker white list.
Thank you for your support.
- PebbleTrader
- rank: 1000+ posts
- Posts: 1633
- Joined: Fri Nov 12, 2010 2:15 am
- Reputation: 15
- Gender:
- PebbleTrader
- rank: 1000+ posts
- Posts: 1633
- Joined: Fri Nov 12, 2010 2:15 am
- Reputation: 15
- Gender:
-
- rank: 50+ posts
- Posts: 50
- Joined: Sat Jun 25, 2011 11:25 am
- Reputation: 0
- Gender:
- PebbleTrader
- rank: 1000+ posts
- Posts: 1633
- Joined: Fri Nov 12, 2010 2:15 am
- Reputation: 15
- Gender:
- PebbleTrader
- rank: 1000+ posts
- Posts: 1633
- Joined: Fri Nov 12, 2010 2:15 am
- Reputation: 15
- Gender:
Please add www.kreslik.com to your ad blocker white list.
Thank you for your support.