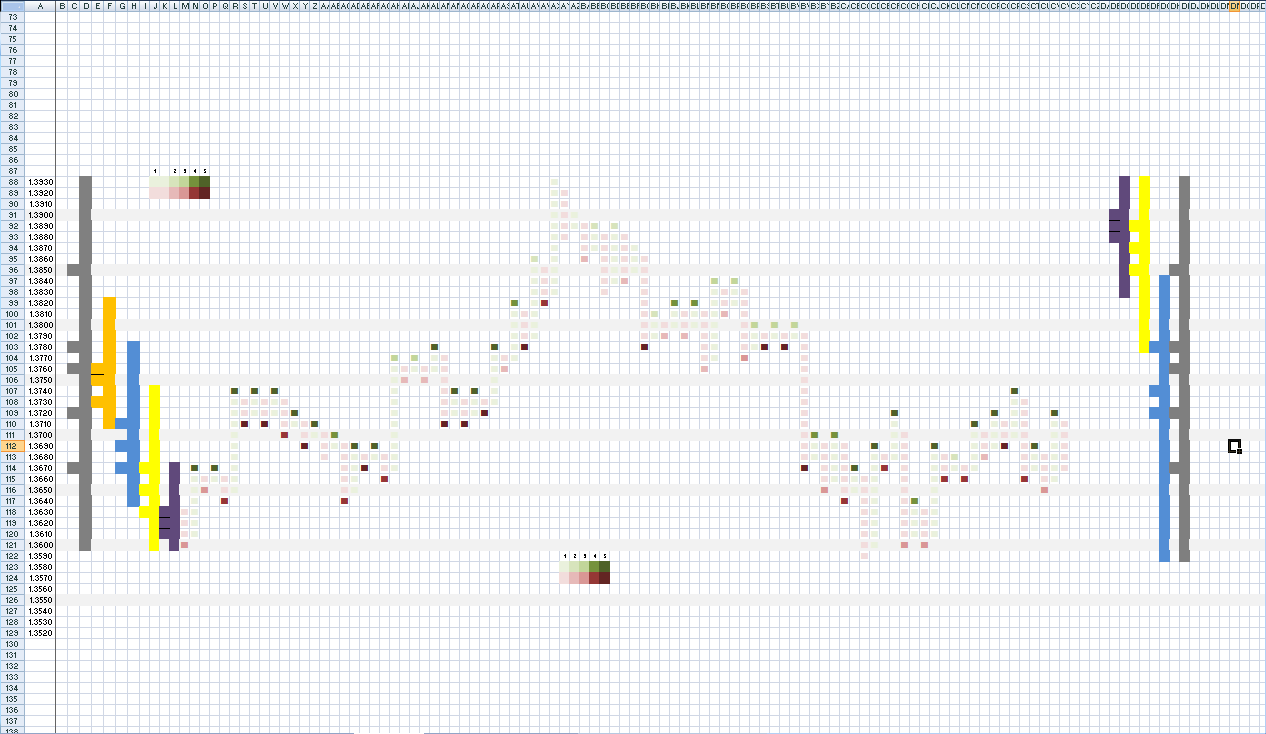
 -note this chart data is wrong in the last 5 or 6 columns
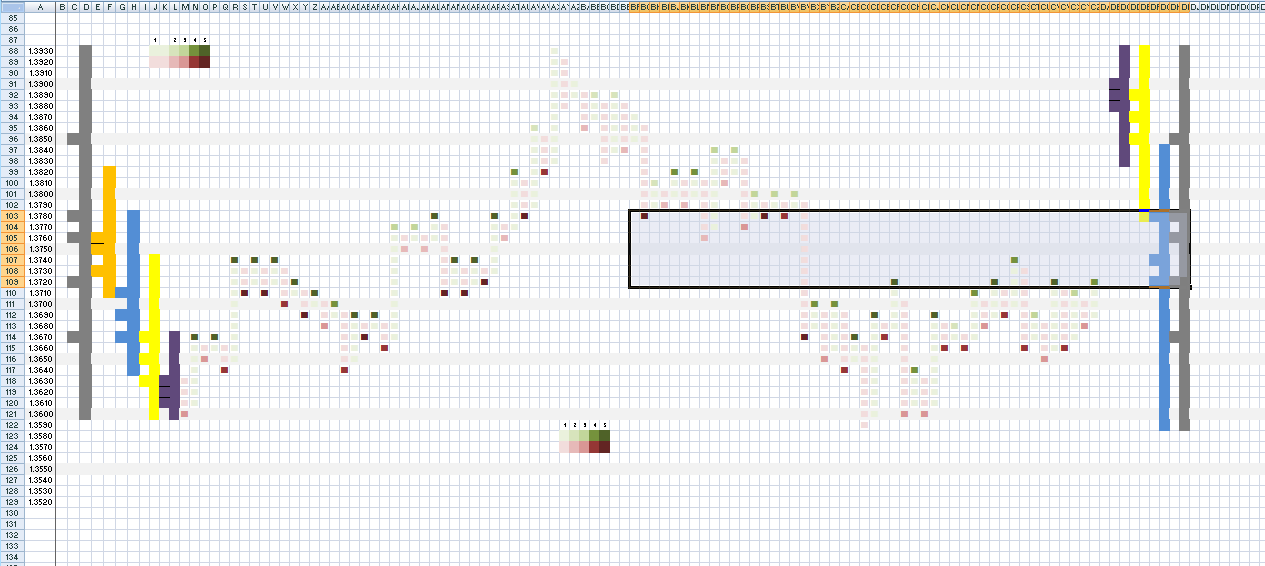
Okay so I was staring at this chart at work today and I saw something regarding Fibonacci... and its quiet obvious that because PnF cut out all the market 'noise' that you would fairly accurate FIB (although not precise, but that doesn't matter because we are just looking for a price level where there is an imbalance)...
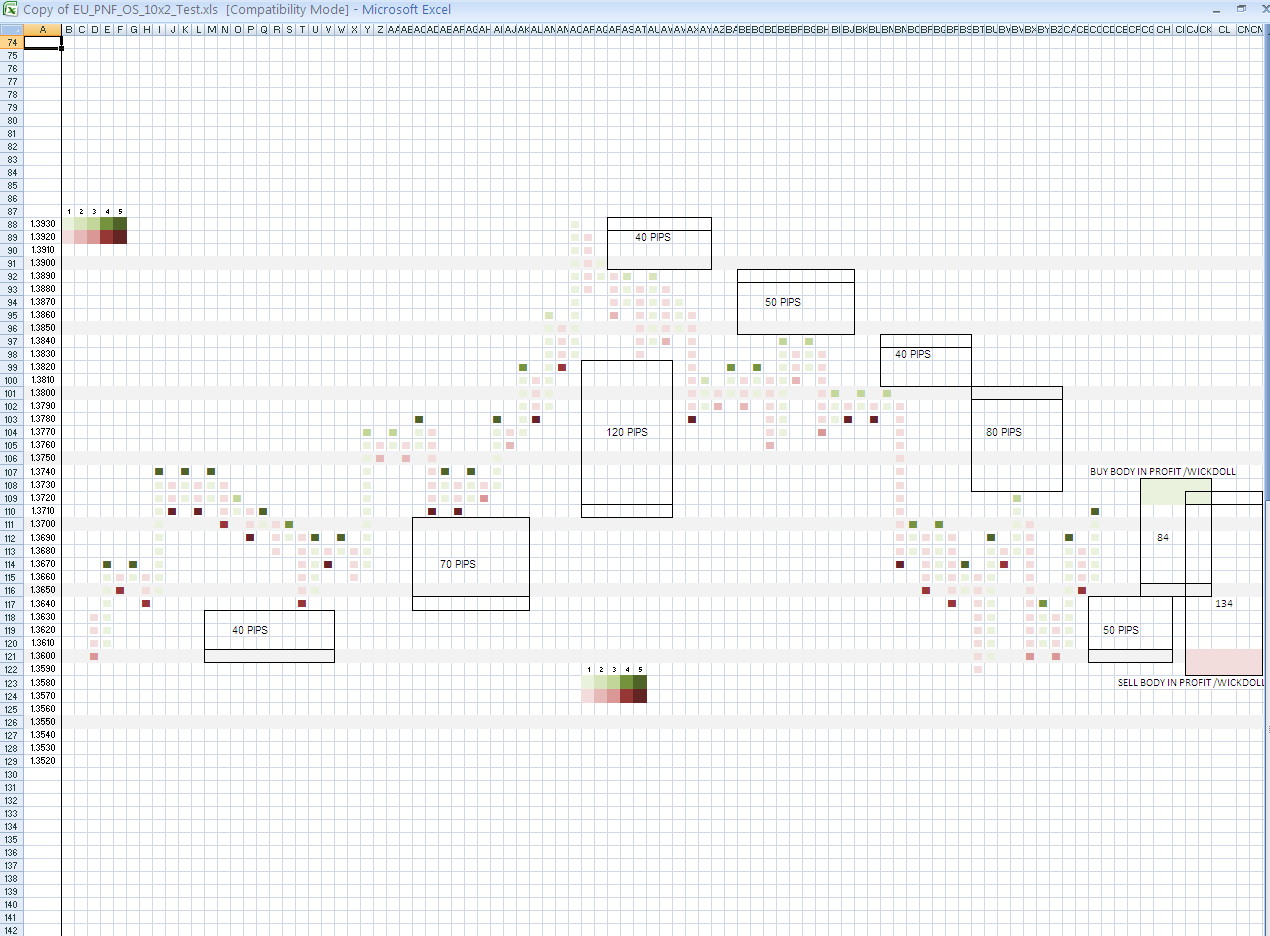
So you'll see that with the above that I was looking at the amount of "space" that can be injected into a trade and it seems to be roughly the initial "open" or wave bottom/top and the base of the lowest/highest retracement (whichever is relevant). So yes this space is roughly - for the most part equal to previous wave VALUE x 1.68 (give or take a few pips)... This shows how much space is potentially availiable to the trader before things go VERY BAD and you have a reversal on your hands... And for some reason also makes good entry points...???
Although I was horribly wrong in my assessment at the end of the chart that I'm sure with further thought and development this idea may sprout something... what that may be yet... I donno... maybe I'm just seeing things

or just stating the obvious...

Okay so here again, perhaps stating the obvious FIB retracements but these add powerful S/R to our base case turnaround scenarios in relation to TAP (Turn Around Point) levels.
There's some very interesting things if you stare at this pic for a while...
I'll leave the ball in your court...
Chart -
http://www.mediafire.com/?flmrpm865zaple6
Fib Calc -
http://www.mediafire.com/?u0lf5yd6ndwlmp5