momo = momentum candle = body has 2x size of the candle before.
the happy-face indicator gives happy faces when the body of a closed candle is bigger than the candle before = momentum increasing (isn´t necesarily a momo)
When you see an x, means candle color changed. My obervation: That happens usually after sad face.
Ive been reading the nla thread up to page 666 yesterday
Thank you everyone for teaching!!!!!
Never Lose Again
Moderator: moderators
Please add www.kreslik.com to your ad blocker white list.
Thank you for your support.
forexjake80 wrote:momo = momentum candle = body has 2x size of the candle before.
the happy-face indicator gives happy faces when the body of a closed candle is bigger than the candle before = momentum increasing (isn´t necesarily a momo)
When you see an x, means candle color changed. My obervation: That happens usually after sad face.
Ive been reading the nla thread up to page 666 yesterday
Thank you everyone for teaching!!!!!
Thanks ForexJake80
when you mentioned momentum increasing isn't necessarily a momo . Sounds confusing and contradicting
- forexjake80
- rank: 50+ posts
- Posts: 137
- Joined: Sun Nov 15, 2009 12:20 pm
- Reputation: 0
- Gender:
illuminatedMind wrote:this is eur/usd h1 chart with horizontal line
so if i understand well the current candle is red if the next candle is green and crosse one of these line il go long right?
if the next candle is red and cross the next line do i go short or i just wait for the next candle to be green?
May i ask what counter is this? I am downloaded the sweetspot counter but it looks different
Please add www.kreslik.com to your ad blocker white list.
Thank you for your support.
what do you think my first trade
I have attached picture. Basically D1 and H1 down, got up cande and then entered as soon next candle headed south hitting the go short line.
Is this right?. I worried i m trading this wrong.
- Attachments
-
- my first trade
- example of trade.jpg (141.6 KiB) Viewed 6678 times
bredin wrote:WooHoo!
12 weeks, 1 move from oz to nz, inumerable head explosions, numberable aha!(tm) moments, lots of trading, reading, screaming, ranting, cursing, crying, point-and-laughing, coding, posting- all while working around a j.o.b. Ive finally read this entire thread.
Ive retired from my job thanks to MO, es/pip, dragon and others who have pointed the way. This thread has been the best and the pointy end of 10 months of hard graft leading to this point. Roll on 2010!
Right, back to the beginning, and I'll have a crack at the more advanced stuff
Congratulations for retiring
es/pip wrote:
Hi, es/pip
May I ask you a quick question
about color convention on your charts.
Do you color all zerolines ("short" and "long" ones)
in the same color
or magenta is for "short" zeroline,
and blue is for "long"?
By "short" zeroline I mean the one, where profit holders
will be "zeroed out" by sell, i.e. - they went long on the
begining of breakout for this zeroline.
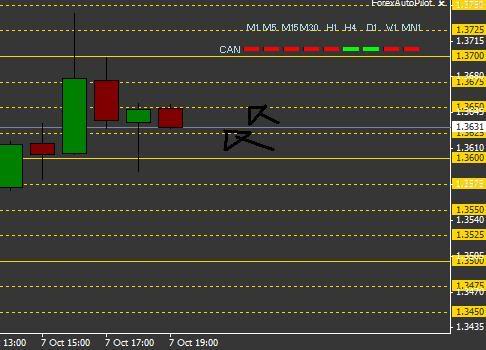
On this particular chart you do have 2 zerolines,
marked in the same magenta color.
Should you follow "different color" convention,
the first zeroline would be magenta, and next one - blue, correct?
And more general question - does it matter, which zeroline it
is - "short" or "long"?
Is it true, that for red (short) zeroline one would expect to sell,
and for blue (long) - expect to buy.
Please add www.kreslik.com to your ad blocker white list.
Thank you for your support.