Never Lose Again

free & uncensored discussion arena for TheRumpledOne

Moderator: moderators

gutek04
rank: <50 posts
rank: <50 posts
Posts: 24
Joined: Sun Aug 30, 2009 8:43 pm
Reputation: 0
Gender: Male

Postby gutek04 » Wed Sep 09, 2009 8:42 pm

cfabian wrote:Dragon...
What is that red line at 1.64615 marked for? What is telling you? Not the stop loss, but the strong one. It is close to a daily ZL, but it is not (at least on mine).

Thanks


Its a H4 ZL line I guess... On my chart its definietly H4 ZL

Please add www.kreslik.com to your ad blocker white list.
Thank you for your support.

User avatar
TheRumpledOne
rank: 10000+ posts
rank: 10000+ posts
Posts: 15555
Joined: Sun May 14, 2006 9:31 pm
Reputation: 3035
Location: Oregon
Real name: Avery T. Horton, Jr.
Gender: None specified
Contact:

Postby TheRumpledOne » Wed Sep 09, 2009 9:04 pm

How to Smell a Rat: The Five Signs of Financial Fraud (Fisher Investments Press) by Ken Fisher & Lara W. Hoffmans


Image
IT'S NOT WHAT YOU TRADE, IT'S HOW YOU TRADE IT!

Please do NOT PM me with trading or coding questions, post them in a thread.

User avatar
aliassmith
rank: 5000+ posts
rank: 5000+ posts
Posts: 5057
Joined: Tue Jul 28, 2009 9:50 pm
Reputation: 2847
Gender: Male

Postby aliassmith » Wed Sep 09, 2009 10:56 pm

Nice little move in early US session.

H1 Chart 10 pips SL a few pips move :roll:
Attachments
aliasgbpusdsep9h1.gif
aliasgbpusdsep9h1.gif (11.98 KiB) Viewed 3537 times

User avatar
es/pip
rank: 1000+ posts
rank: 1000+ posts
Posts: 2898
Joined: Wed Jan 21, 2009 9:28 pm
Reputation: 11
Gender: None specified

Postby es/pip » Wed Sep 09, 2009 11:37 pm

aliassmith wrote:Nice little move in early US session.

H1 Chart 10 pips SL a few pips move :roll:


:D :D
Bend over and assume the position for another 4 years of hope and change.

JTurnbull
rank: <50 posts
rank: <50 posts
Posts: 12
Joined: Mon Apr 13, 2009 10:48 pm
Reputation: 0
Gender: None specified

EU has something forming

Postby JTurnbull » Wed Sep 09, 2009 11:46 pm

Looks like something forming on EU if we get some more weakness out of it. could be a good setup for another leg up further
Image
Also just making sure i still remember how to post images.

Please add www.kreslik.com to your ad blocker white list.
Thank you for your support.

User avatar
es/pip
rank: 1000+ posts
rank: 1000+ posts
Posts: 2898
Joined: Wed Jan 21, 2009 9:28 pm
Reputation: 11
Gender: None specified

Postby es/pip » Wed Sep 09, 2009 11:51 pm

lukx wrote:another quick question.
What if we have MOMO long, we're waiting one candle went up and another one hit ZL bit the one that hit ZL was also MOMO but for short?

Image


huh?


rephrase that or post a larger chart showing what you are saying
Bend over and assume the position for another 4 years of hope and change.

User avatar
prochargedmopar
rank: 10000+ posts
rank: 10000+ posts
Posts: 12048
Joined: Sat Dec 20, 2008 6:07 am
Reputation: 1790
Location: Granbury, TX
Gender: Male
Contact:

Postby prochargedmopar » Thu Sep 10, 2009 1:54 am

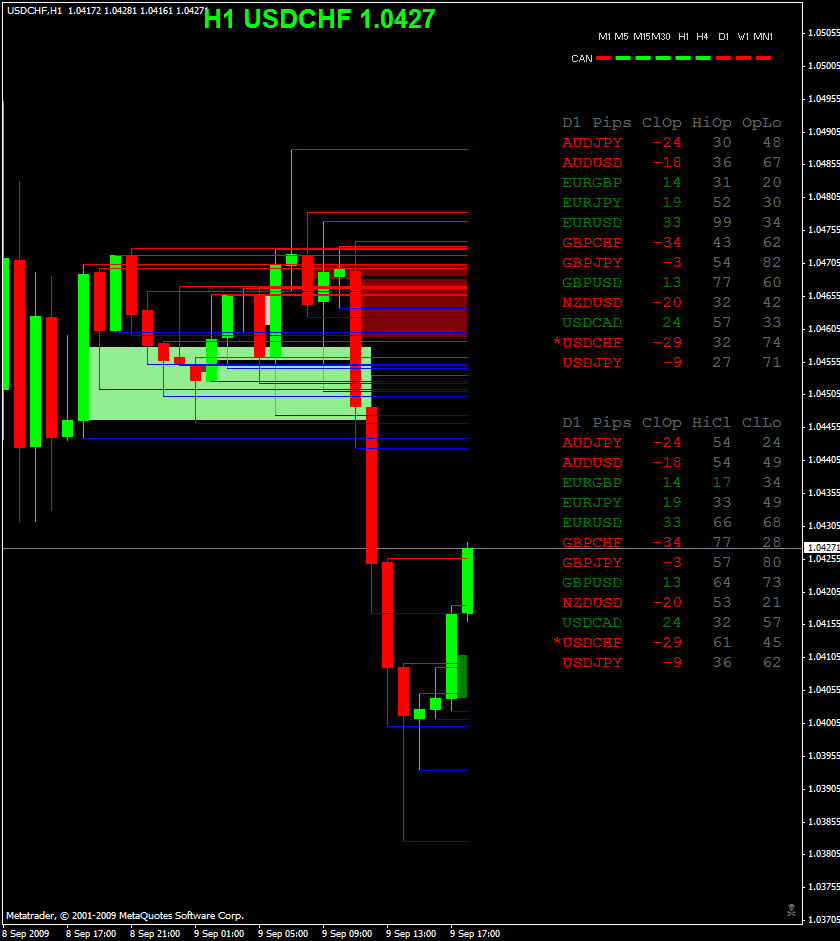
TheRumpledOne wrote:Image

Let's see...

Enter within 20 pips of the bottom...

Price now 45 pips off the bottom...

Hmmm.....


TRO,
I can see that you have adopted some of the good Dr.'s trading strategies.
Trading off daily extremes..........
So do you have the saxo bank link bookmarked?

I'm going to have to look through your indi's for a better daily avg indicator than what the dailydatav.2 is showing.
#1BODY in direction of profit #2INCREASE lot size Obsessively
My Losses cause me Great Laughter!
Trading Bible here> therumpledone/the-ideas-that-i-trade-by-t3256/page1670

User avatar
dragon33
rank: 500+ posts
rank: 500+ posts
Posts: 792
Joined: Thu Sep 18, 2008 2:41 pm
Reputation: 70
Gender: Male

Postby dragon33 » Thu Sep 10, 2009 7:41 am

cfabian wrote:Dragon...
What is that red line at 1.64615 marked for? What is telling you? Not the stop loss, but the strong one. It is close to a daily ZL, but it is not (at least on mine).

Thanks


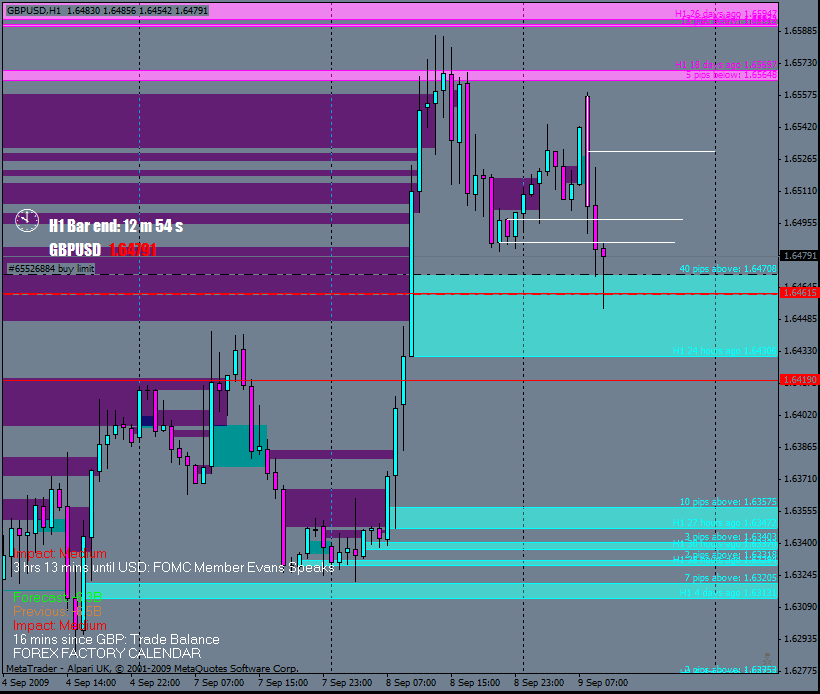
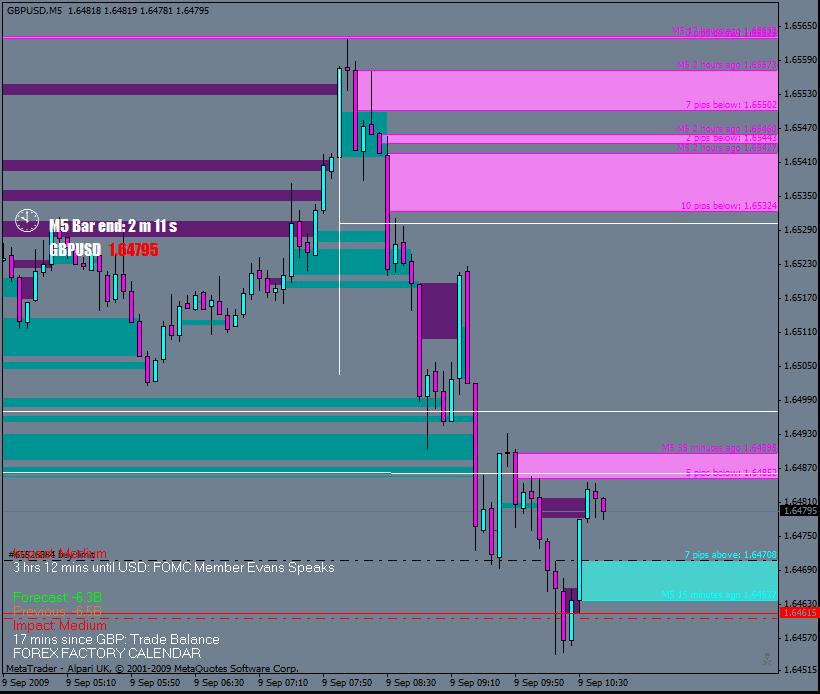
dragon33 wrote:How to miss a trade by a few pips :evil: :cry:
That's what you get when setting things and doing other things. I rarely use limitorders to prevent this.

Image

Image

Image


I mark the zones from the higher frames. The first red is H4 and the second is the income from the daily.
The zone indicator does not mark every possible reverse. That's the reason why i do it by hand. If price comes near my lines i scale in to M5!
Trading is like cycling, first you need to learn how.
Two options: you either lose or win!

User avatar
dragon33
rank: 500+ posts
rank: 500+ posts
Posts: 792
Joined: Thu Sep 18, 2008 2:41 pm
Reputation: 70
Gender: Male

Postby dragon33 » Thu Sep 10, 2009 9:01 am

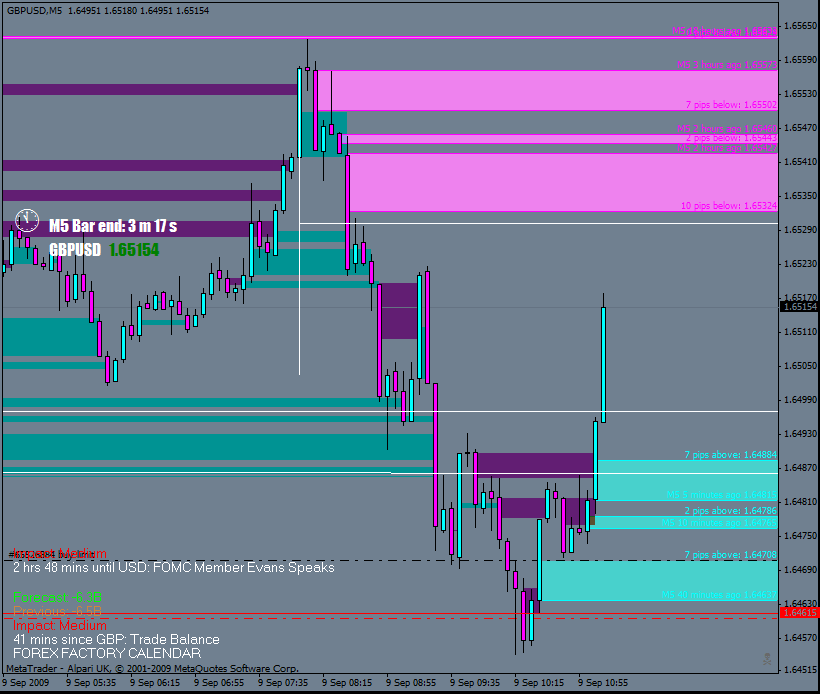
This is why it is important to draw manually on momo candles.

Here you can see a momo reversal pattern. First we have a small momo to the upside but on the smaller timeframe you are able to catch the breakout the othere way.

Image

Image
Trading is like cycling, first you need to learn how.

Two options: you either lose or win!

User avatar
lukx
rank: 500+ posts
rank: 500+ posts
Posts: 789
Joined: Wed Feb 04, 2009 5:10 pm
Reputation: 2
Gender: Male
Contact:

Postby lukx » Thu Sep 10, 2009 9:21 am

huh ?! I don't get it... on 4H this momo was long so we shoudl be looking to enter long on pullback. How did you know it will be breakout when price will hit ZL on this long momo on 4H

Please add www.kreslik.com to your ad blocker white list.
Thank you for your support.


Return to “TheRumpledOne”