

Lukx
Great charts posted at 2:30pm today, and the trade is even prettier than the charts!!!. Could you enplain the reasons for your entry and exit? and if you could comment on what the difference is between today's results and a week or two ago's?
Congratulations, you are on your way,
Patch
Never Lose Again
Moderator: moderators
Please add www.kreslik.com to your ad blocker white list.
Thank you for your support.
Thank you for your support.

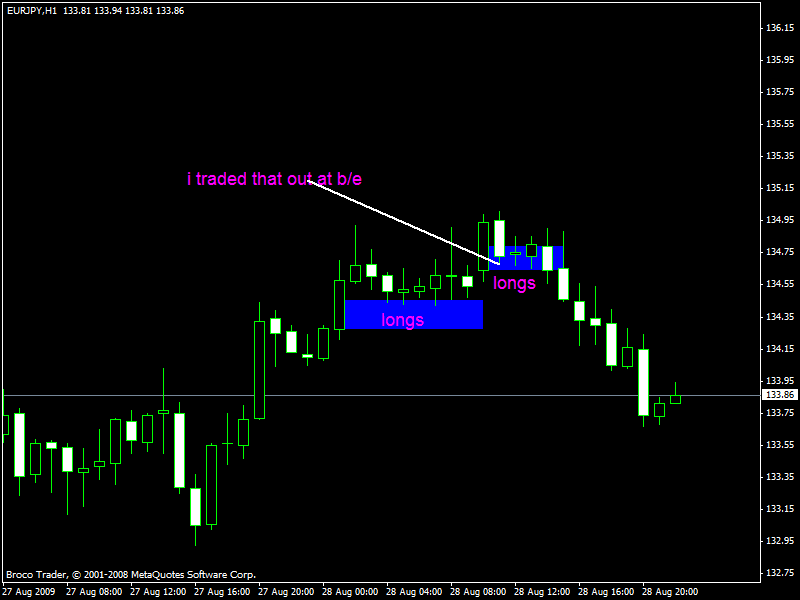
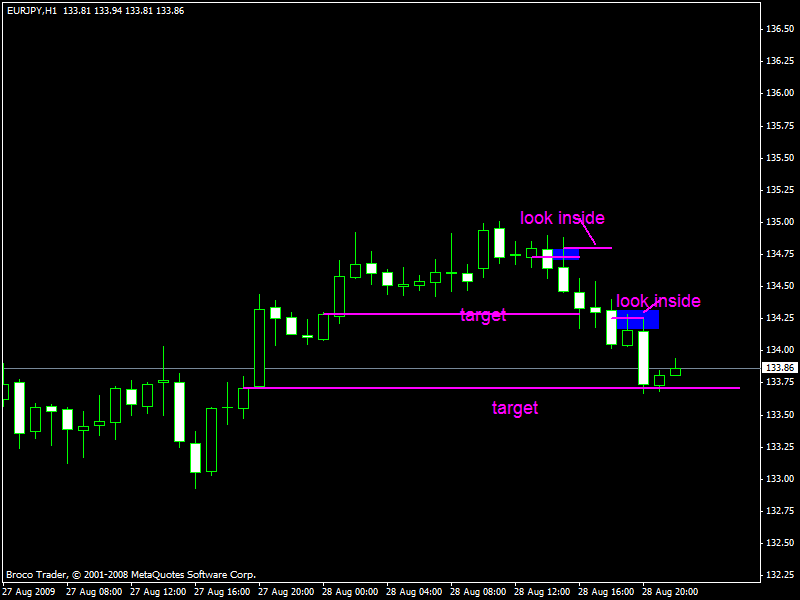
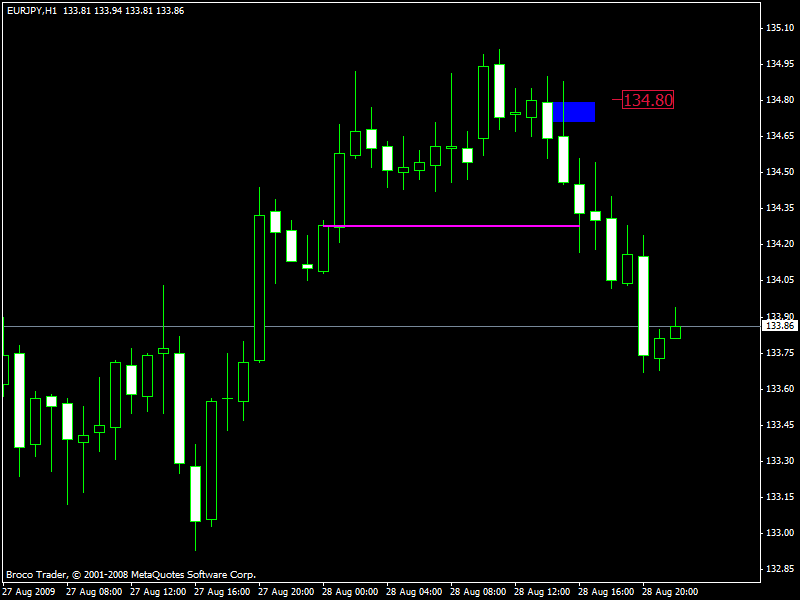
Jeff, here's how I saw that:
4H ZL line on green momo... so I should be ready to go long...but when I took look at 5M with I saw 1H momo short so decided to wait and see what might happen if the price would go up to 4H momo ZL I would be prepared to take long... but it went down so I waited for another 1h momo ZL2 and took short when price was there. I set 15pips SL based on top of momo to and let it go. As dragon wrote you got to go inside timframes to see extra information it might have. But basically I always wait for pullback and go with momo color based on timeframe I'm looking at.

4H ZL line on green momo... so I should be ready to go long...but when I took look at 5M with I saw 1H momo short so decided to wait and see what might happen if the price would go up to 4H momo ZL I would be prepared to take long... but it went down so I waited for another 1h momo ZL2 and took short when price was there. I set 15pips SL based on top of momo to and let it go. As dragon wrote you got to go inside timframes to see extra information it might have. But basically I always wait for pullback and go with momo color based on timeframe I'm looking at.
-
aliassmith

- rank: 5000+ posts

- Posts: 5057
- Joined: Tue Jul 28, 2009 9:50 pm
- Reputation: 2847
- Gender:

Thought I would post some M5 trades from yesterday.
The first is a "Close in direction of profit" and "Wick in direction of loss"
The second trade was a S/R trade away from a MZ area.
First trade 1.6 R:R
Second trade 3.2 R:R
At 4% risk there is 19% return
The first is a "Close in direction of profit" and "Wick in direction of loss"
The second trade was a S/R trade away from a MZ area.
First trade 1.6 R:R
Second trade 3.2 R:R
At 4% risk there is 19% return
- Attachments
-
- aliasgbpusdaug28m5.gif (20.93 KiB) Viewed 4179 times


Fxtraveller wrote:May I ask some advice?
A) are the zlines/zones identified correctly by blue boxes 1 and 2?
B) in both cases profit could have been made from pullbacks marked by arrows .
Where to enter?
case 1: buy when reaches its? thats going against some momo. dont we need to wait for the closed body?
if yes, price wicks zline, H1 closes. Open a buy straight away? or wait for the price to move, perhaps ho to a smoller timeframe?
case2: after a bull candle zeroes out sellers, next (last) candle is of high momo. until price actually goes down, we dont know here it will go.
So the point of all of this- what is (are) the best triggers to enter trade when trading zlines?
no that is not correct
the first mz box is wrong
the second is possibly correct depending on which actual candle you are basing it off of--- anchor it to the candle that your are basing it off of.
tell me
what is the definition of a mz?
as far as the longs i am pointing out--- they are possible trades and are riskier the higher you have moved due to the held profit beneath you
assuming your mz and zl is correct--as far as taking that first long you pointed out i would not trade that based off what you are looking at----- if i was going to even think about it i would dial down and see if i had an increase in momo and trade it off that off of the higher time frame s/r---- but, i would be very careful and would be looking for the first sign to get out
the second trade short---- that is a trade i took today----
1. it happens on consecutive bars
2. there was a clear target of held profit they were looking to take out
but and i also did this
the short trade started off the top when the momo started increasing. So, as you are playing it further down it is riskier--- bec you have held profit above you.
"So the point of all of this- what is (are) the best triggers to enter trade when trading zlines?[/quote]"---YOU
ME---- you are going to need to figure out an entry technique that works for you. Mine is discretionary and is different on every trade
i am going to post some charts here in min i have to mark them up
but here is what i would have been looking at based just on that chart sequence based just on the h1
Bend over and assume the position for another 4 years of hope and change.
-
aliassmith
- rank: 5000+ posts
- Posts: 5057
- Joined: Tue Jul 28, 2009 9:50 pm
- Reputation: 2847
- Gender:
I seen MO sort of elude to this idea in at least one of his posts.
I was playing around with some rate of returns and compounding them
to see if what I thought MO mentioned was correct.
It turns out that if you have $5000 to invest that you are better off
investing $2500 and risking 4% per trade than invest $5000 and
risking 2% per trade. (assuming a 20% return per week on 2%risk per trade)
$10,380 after 4 weeks from $5000 and 2% risk/trade
$9,604 after 4 weeks from $2500 and 4% risk/trade
So, what I mean by better off is that you keep less capital in your account and you can have the other half of your capital under your matress, in case you have some drawdown.
Test everything!
Please add www.kreslik.com to your ad blocker white list.
Thank you for your support.
Thank you for your support.
here are some i made today---- i made a lot more trades than this but these are the ones that are clear--------
sometimes i will fade the momo if it is coming into a larger zline-- by dialing down and looking for something i like----- momo reversing inside the larger momo as long as it is zl'ing other traders. but also has to do with how it comes in to the area and how it leaves it based on how the bars form. i am very quick to cut it if it doesn't go right away. those setups carry more risk.
--- like on the pound when it made the double toppish kinda pattern on the 3 consecutive h1 bars( which was also coming into a h4 zl) i got short when it failed on the m5 and rode it down to the h1 zl and then did the same thing off that zl back up to the h1 zl and then got short of the chart i posted on the pound
i have shown some of those in the past but it will just be too confusing if i post any of those---- they shouldn't be traded anyway if you dont understand the first stuff --- so here are the clear ones
basically you want movement/momo in order to even consider trading
then you want to trade in the direction of the momo
targeting other traders that are holding onto their profit
i also had 3 or so b/e one -3 and a -7
Bend over and assume the position for another 4 years of hope and change.

aliassmith wrote:I seen MO sort of elude to this idea in at least one of his posts.
I was playing around with some rate of returns and compounding them
to see if what I thought MO mentioned was correct.
It turns out that if you have $5000 to invest that you are better off
investing $2500 and risking 4% per trade than invest $5000 and
risking 2% per trade. (assuming a 20% return per week on 2%risk per trade)
$10,380 after 4 weeks from $5000 and 2% risk/trade
$9,604 after 4 weeks from $2500 and 4% risk/trade
So, what I mean by better off is that you keep less capital in your account and you can have the other half of your capital under your matress, in case you have some drawdown.
Test everything!
In the past i traded with a big account so i could play with very high lotsize. After MO mentioned the above i have changed a lot.
You don't need a big account to trade high returns! You only need to master this concept or you burn your ass.
Trading risknumbers as 4% or more are only possible if the probability of your wins are high.
Trading is like cycling, first you need to learn how.
Two options: you either lose or win!
Two options: you either lose or win!
-
brettnchrism

- rank: 150+ posts

- Posts: 196
- Joined: Wed Feb 18, 2009 8:25 pm
- Reputation: 49
- Location: Dade City Florida
- Gender:

Somewhere along the way I remember a TRO indicator that would plot fib retracment dots inside the candles. I have the 1/3rd dots but thats not the one.
It may be fibb retracement dots but I cant seem to find it in all my searching. I like the 50 percent dots for visual without all the lines on my chart. Thanks, brett
It may be fibb retracement dots but I cant seem to find it in all my searching. I like the 50 percent dots for visual without all the lines on my chart. Thanks, brett
Your friend Brett
brettnchrism , is it what you are looking for?
- Attachments
-
 TRO_DYNAMIC_FIBS_SR.ex4
- (18.9 KiB) Downloaded 232 times
-
prochargedmopar

- rank: 10000+ posts

- Posts: 12048
- Joined: Sat Dec 20, 2008 6:07 am
- Reputation: 1790
- Location: Granbury, TX
- Gender:
- Contact:
Yeah, brett,
Just set the showfibs to true.
You can have them shifted by changing that setting to 1. If needed.
Just set the showfibs to true.
You can have them shifted by changing that setting to 1. If needed.
#1BODY in direction of profit #2INCREASE lot size Obsessively
My Losses cause me Great Laughter!
Trading Bible here> therumpledone/the-ideas-that-i-trade-by-t3256/page1670
My Losses cause me Great Laughter!
Trading Bible here> therumpledone/the-ideas-that-i-trade-by-t3256/page1670
Please add www.kreslik.com to your ad blocker white list.
Thank you for your support.
Thank you for your support.