So simple.
Moderator: moderators


TheRumpledOne wrote:Shane wrote:EUR = 60 pips and climbing
JPY 2 runs of 20 pips each (in hour 10)
I can see why Dragon likes this indicator so much. wish I had started using it sooner.
Great stuff TRO...you're a legend!
***just as I was posting the Euro is stalling at 90 pips profit!!!***
Ok Shane:
Good trading!!
Your homework assignment is to write up EXACT trading rules for what you are doing and post them here. Perhaps you can explain it in a way that someone who is struggling can understand.
Thanks.
razorboy wrote:Wrote these notes last night.....the first paragraph rambles a bit
Here is the consistent pattern, regardless of H1 and D1 colour. Going in the
direction of H1 and D1 colour is the optimal solution. Going with H1
color is ok as well. you can go against h1 and d1, but it is risky - you may get one fast candle going your way
This is using the dynamic fib lines ....the dots. The key, more than
color candle of the candle making resistance, is the relation ship of the
close of this candle and the opens of following candles.
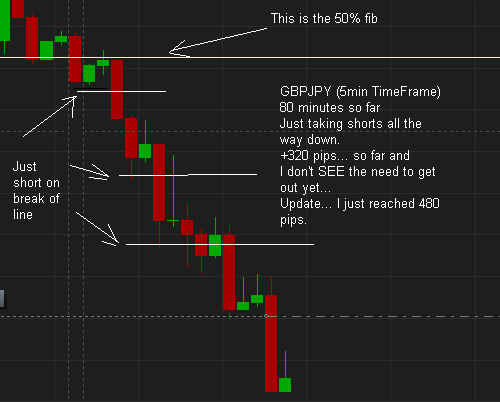
Bouncing off resistance on an M5 chart
A green candle (usually) hits resistance...red dots start to form. Wait
for this candle to close. Look for the next candle to open at or below
the close of the first candle, it is not always the next candle, but
usually follows soon after. It may or may or may not reach up to touch
resistance, so it may or may not turn green as it makes a long wick. What
you are looking for is for this red candle to fall below the pivot point
created by the candle that made the high. Short it when it crosses this
line - it is indicated on the chart (magically, sometimes it does stall
here). The important part to watch is the relationship between the close
the prior candle and the open of the new one that you are expecting to
fall thru the short line.
I have strayed away from using pivot points for entrys. When you get a long candle with a long wick that makes the sup/res, the pivot is too far away from the s/r line to make an entry - often the move is almost done by the time the pivot is hit and entry signalled. And (like you said) the price often stalls at the 5 min pivot - I don't like entering when the price is stalling.
The idea is that price has stalled - no more higher opens
Bouncing off support
A red candle (usually) hits support. Blue dots form. Wait for this
candle to close. Look for the next candle that open at or above the close
of the red candle that marks the support line (it may not always be the
next candle). This candle may reach down to the support - long shadow,
so it may go red for a bit. What you are looking for is for the green
candle to come up and cross the pivot point, which is the buy line, you
buy when it cross this line (again watch for stalls at this line). Again
the important part is to watch the relationship between the close of the
higher candle and the open of the new one. the new one should open at or
above the close of the candle that started to form the support line.
Look at the pattern on these charts
http://forums.babypips.com/show-me-mone ... #post74080.
On this chart look at the last series of resistance dots.
H1 was still green
1. a green candle made resistance
2. next candle opened below close of green and below the short line, went
up a bit, then fell and bounced back up. Depending on your timing, you
could have lost money - you would have been going against H1
3. There are two green candles
4. there is the first of two red candles, this first red candle meets the
criteria of falling thru the sell line, but h1 is still green.
5. The second of two red candles. H1 has turned red, red candle is below
short line, but the open is higher than the close that made the resistance
line.
6. a Green candle
7. A red candle. Open is lower than the close of the green candle that
made resistance and we are below the short line - this was a safe entry
I am red/green colourblind. Let's just say i am glad I had coffee before I tried to relate this description to the chart. lol
You can see that when the candle hit support, there was a buy opportunity.
1. Open of the green candle was at or above the close of the red candle
that made the support line, h1 was green, and the candle was above the buy
line
More charts
http://kreslik.com/forums/viewtopic.php ... &start=560
First Chart on the page, with the double blue arrows.
A candle formed support. We are now looking for candle going in the
opposite direction that has 3 things.
1. it agrees with H1
2. It open is at or above the close of the candle making the support line
3. It crosses the buy line. which is the pivot point of the candle that
created the support line - happened 3 candles following the support making
candle
ON MY CHARTS THE BUY LINE IS NOT THE PIVOT POINT.
THE BUY LINE IS AN 11.8% FIB!!!
THE SELL LINE IS AN 88.2% FIB!!!
another chart
http://kreslik.com/forums/viewtopic.php?p=12038#12038
Follow the pattern across the screen starting from earlier in the day.
you will see that although there are situations where the above conditions
are not met, for example green candle makes resistance and the next candle
is red, but its open is above the close of the green, you could have made
a short trade, but you wont see a big move (you can find example to
disprove me on this chart, but i would have just waited for the right
candle to enter on, rather than risk having the trade come back on me)
An additional caveat.......never chase women, buses, elevators or price............you will always get left behind, and another one usually comes along in about 2 minutes.........
dragon33 wrote:xmess7 wrote:dragon33 wrote:Trading session today starts with a 15 pip gain.
sell at 1.5999 on the red candle after the green.
Dragon:
What made u decide to short the red candle on this chart you posted?
Is that red line at 1.60030 the Open Price of H1?
Thnx
Jess
Yes it is, H1 turns red on that line