Never Lose Again

free & uncensored discussion arena for TheRumpledOne

Moderator: moderators

User avatar
prochargedmopar
rank: 10000+ posts
rank: 10000+ posts
Posts: 12048
Joined: Sat Dec 20, 2008 6:07 am
Reputation: 1790
Location: Granbury, TX
Gender: Male
Contact:

Postby prochargedmopar » Sun Aug 09, 2009 3:38 am

Perfect, for my net-book anyway.
Not quite big enough for the 22"
I'm ready.

Image

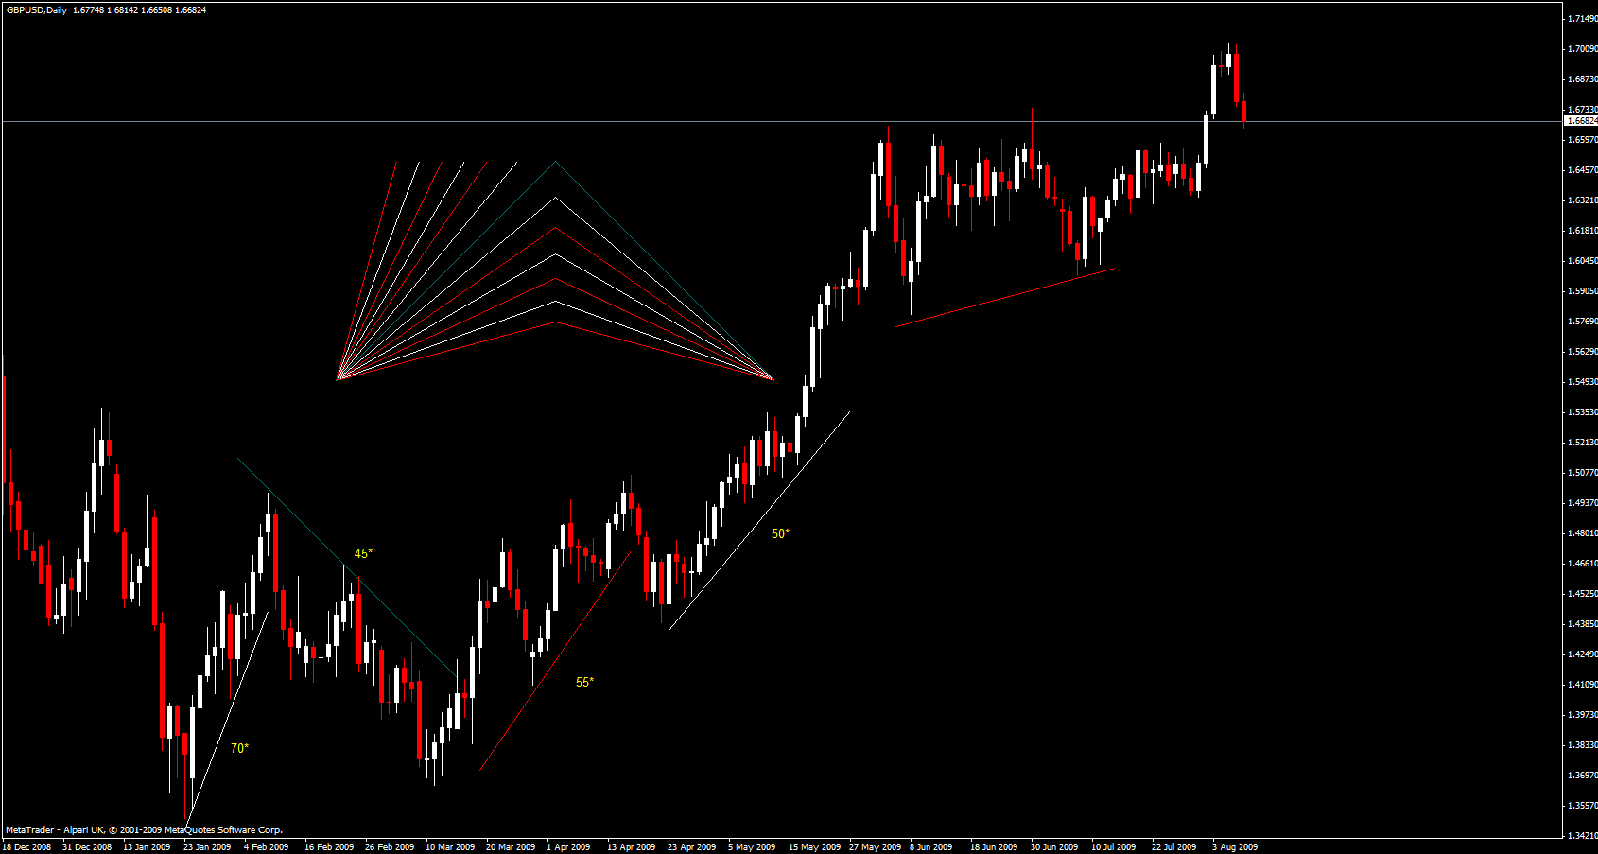
It seams all you need to know is current angle and channel width.
Pop a trend line....check the angle.....look to right to check the height, calculate next move.

Hmmmmmmm
#1BODY in direction of profit #2INCREASE lot size Obsessively
My Losses cause me Great Laughter!
Trading Bible here> therumpledone/the-ideas-that-i-trade-by-t3256/page1670

Please add www.kreslik.com to your ad blocker white list.
Thank you for your support.

User avatar
prochargedmopar
rank: 10000+ posts
rank: 10000+ posts
Posts: 12048
Joined: Sat Dec 20, 2008 6:07 am
Reputation: 1790
Location: Granbury, TX
Gender: Male
Contact:

Postby prochargedmopar » Sun Aug 09, 2009 4:09 am

blubbb,
Instead of having the multiple time frame z-lines and all those crazy looking colored boxes (mighty zones) from larger time frames cluttering up the screen.............

How about adding z-lines to your custom_candle indicator.

I could trade 1 timeframe and move the indicator around to find the z-lines I'd like to trade toward or away from.
It would be great....Closed bodies are TRUTH.
The only wicks you'd see would be your entrance at a "better price" per MightyOne,
on the smaller time frame of the chart you have open.

How sweet would that be?
Custom candle/Z-line combo......
No need for mightyzones for those that can see this anyway.
Those who can't see yet can use the other indicators for "training" purposes.
#1BODY in direction of profit #2INCREASE lot size Obsessively
My Losses cause me Great Laughter!
Trading Bible here> therumpledone/the-ideas-that-i-trade-by-t3256/page1670

User avatar
monolisa
rank: 150+ posts
rank: 150+ posts
Posts: 351
Joined: Fri Jun 12, 2009 11:38 am
Reputation: 0
Location: All Quiet on the Western Front
Gender: None specified

Postby monolisa » Sun Aug 09, 2009 5:21 am

I think it's a good idea. However if you know what you are doing you don't even need any zl/mz indicator :P

Lis
"Know your enemy and know yourself, find naught in fear for 100 battles. Know yourself but not your enemy, find level of loss and victory. Know neither your enemy or yourself, wallow in defeat every time." - Sun Tzu

User avatar
monolisa
rank: 150+ posts
rank: 150+ posts
Posts: 351
Joined: Fri Jun 12, 2009 11:38 am
Reputation: 0
Location: All Quiet on the Western Front
Gender: None specified

Postby monolisa » Sun Aug 09, 2009 7:44 am

Nice set of instrument, Pro :)

I think an indi could be used to draw the lines easily (master coder TRO/blubbb/whoever might be able to help developing the indi). What you need are:
1. Time/price of the lower left corner of the square (t1/p1)
2. The time period of the square (in bars) (b)

You can then determine the square's right upper corner, which is the intersection of a 45* trendline from the starting point and a vertical line at the end of the time period. Let's say the price difference is k (in pips).

Now you have the co-ordinates of the 2 corners. Using simple calculations you can find out the 2 co-ordinates of the angled trendlines. For example, these are the co-ordinates of a 30* trendline (uptrend):

Time(lower left corner) = t1
Price(lower left corner) = p1
Time(upper right corner) = t1 + b - 1
Price(upper right corner) = p1 + tan(30*pi/180) * k / 1000

For angles above 45* it's the number of bars that varies. Here's an example of a 60* trendline (uptrend):

Time(lower left corner) = t1
Price(lower left corner) = p1
Time(upper right corner) = t1 + ROUND(b * (tan(60*pi/180))^-1) (I round it because time bar could not be divided)
Price(upper right corner) = p1 + k / 1000

Here are the DOP lines I have manually drawn using the calculation methods above.

Image

Lis
"Know your enemy and know yourself, find naught in fear for 100 battles. Know yourself but not your enemy, find level of loss and victory. Know neither your enemy or yourself, wallow in defeat every time." - Sun Tzu

User avatar
prochargedmopar
rank: 10000+ posts
rank: 10000+ posts
Posts: 12048
Joined: Sat Dec 20, 2008 6:07 am
Reputation: 1790
Location: Granbury, TX
Gender: Male
Contact:

Postby prochargedmopar » Sun Aug 09, 2009 8:25 am

monolisa wrote:I think it's a good idea. However if you know what you are doing you don't even need any zl/mz indicator :P

Lis


Ah, yes, you are so correct...

The reason I ask is because I no longer trust the h4 chart. It shows to be different from different brokers.
The bar chart and body's used for "finding" momo of the higher timeframe with blubbb_customcandle helps us all. Having the zl line for a quick reference point to focus on price retraces would be helpful. And what about a multi-pair multi-meter like TRO is always developing. Hmmmmm

At this point I am just now going to start looking at 2 pairs but one day I would like to search for momo on 8.
#1BODY in direction of profit #2INCREASE lot size Obsessively
My Losses cause me Great Laughter!
Trading Bible here> therumpledone/the-ideas-that-i-trade-by-t3256/page1670

Please add www.kreslik.com to your ad blocker white list.
Thank you for your support.

User avatar
monolisa
rank: 150+ posts
rank: 150+ posts
Posts: 351
Joined: Fri Jun 12, 2009 11:38 am
Reputation: 0
Location: All Quiet on the Western Front
Gender: None specified

Postby monolisa » Sun Aug 09, 2009 8:28 am

Hi MO,

I presume the channel width you are talking about is the perpendicular distance between the upper and lower limit of the channel.

Lis

MightyOne wrote:
202 Lesson 2: Proportions


A 90* angle would have a channel width of how many pips?

ZERO!

A 15* angle would have a channel of how many pips?

More than 30, 45, 60, & 75* angles.

Out of 18 possible angles the chart is most likely to run at an angle between 25 & 65 degrees.

25-30-35-40-45-50-55-60-65

Of these angles the chart will be running at 2 of 3 angles within a group of angles:

25-30-35

40-45-50

55-60-65

By considering the size of the channel captured by an x* angle one can narrow the possibilities down significantly and make a high probability guess as to what the chart will do in the future.

(This is one of those you get it or you don't posts...I am not taking questions at this time)

Image
"Know your enemy and know yourself, find naught in fear for 100 battles. Know yourself but not your enemy, find level of loss and victory. Know neither your enemy or yourself, wallow in defeat every time." - Sun Tzu

Who Am I ?
rank: <50 posts
rank: <50 posts
Posts: 17
Joined: Fri Jul 31, 2009 1:56 pm
Reputation: 0
Gender: None specified

Postby Who Am I ? » Sun Aug 09, 2009 9:03 am

Hi,

These are my diamond of perception drawings:

Image

Changed the scale, but, channels remain intact....

Image

User avatar
dragon33
rank: 500+ posts
rank: 500+ posts
Posts: 792
Joined: Thu Sep 18, 2008 2:41 pm
Reputation: 70
Gender: Male

Postby dragon33 » Sun Aug 09, 2009 10:15 am

blubbb wrote:This is my version of MightyZones. Tell me if the alert is correct and I'll put it in my indi thread.


Hi Blubbb, the importance of the use of the alert is just trading multiple pairs.
For some reason i only like to trade one pair because it is much easier to follow.
But when i'm able to manage the bigger zones on other pairs that must be huge!
Another request is how to change the alert wav?
I know i can record an alert by myself. Is it enough to put that alert in the sound folder and change wav name into what i would like to have? Then i have to change the name in the source to my recorded name, right?
I let you know of the alert is right! Does it alert when zone is wicked or before?

User avatar
blubbb
rank: 150+ posts
rank: 150+ posts
Posts: 219
Joined: Mon Sep 29, 2008 8:07 pm
Reputation: 0
Location: Europe
Gender: Male

Postby blubbb » Sun Aug 09, 2009 10:34 am

The alert goes off when the price touches the zone. You can change the sound file by changing the "SoundFile" input string (when adding the indi to a chart).

User avatar
Patch
rank: 500+ posts
rank: 500+ posts
Posts: 941
Joined: Sat Jan 06, 2007 6:13 pm
Reputation: 0
Location: Virginia
Real name: Jeff
Gender: Male
Contact:

Postby Patch » Sun Aug 09, 2009 1:15 pm

dragon33 - blubbb - MO

At what time in the D1 chart do you plot your angles and do you have any sense of how the project into the blank right side of the chart? -- Patch
ENOUGH being a Yalie for me Back to the Sea. "What i can lose, i can win" "YES YOU CAN" - dragon33 -"Pick one method and one pair and stick with them until you master it. "The choice is yours - success or failure." TRO

Please add www.kreslik.com to your ad blocker white list.
Thank you for your support.


Return to “TheRumpledOne”