
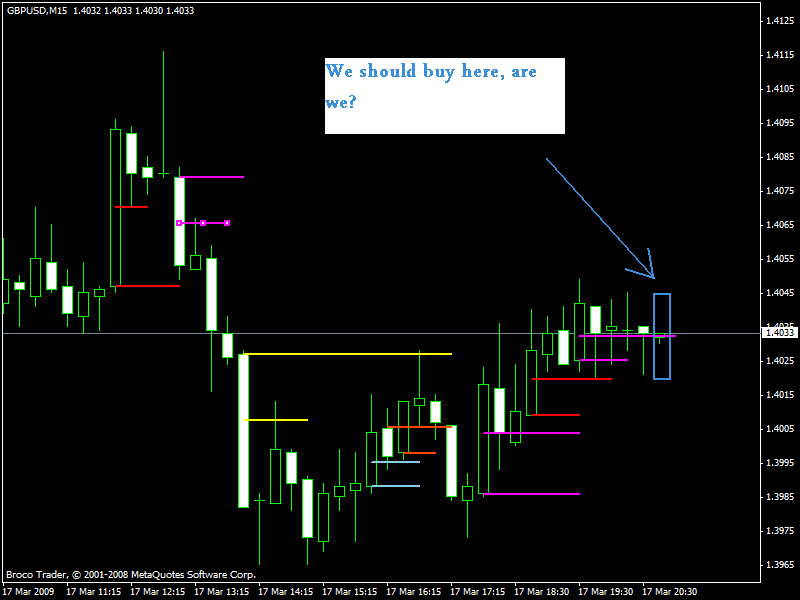
I think the first two labels (the two bottom ones) are long entries, the top label is the target. Yellow line is ZL.
Please correct me if I'm wrong es/pip
I remember someone mentioning something about how the tro dyn sr (or one of the support/resistance indicators) can be used to determine the ZL? Is this true? In the image es/pip posted it seems like it can be.. where the yellow line starts -- that candle has a 'dot' where resistance is and once broken, becomes the ZL. Comments?
Never Lose Again
Moderator: moderators
Please add www.kreslik.com to your ad blocker white list.
Thank you for your support.
Thank you for your support.


TheRumpledOne wrote:"es/pip"
What did you do and why did you do it?
i made money, bec i wanted to make money
j/k
body two times the prev body= mighty zone
went long half at first price marker and half at other price marker
didnt have a target in mind got out on the slam bar with the wick at other price marker
pierre23 wrote:I think the first two labels (the two bottom ones) are long entries, the top label is the target. Yellow line is ZL.
Please correct me if I'm wrong es/pip
I remember someone mentioning something about how the tro dyn sr (or one of the support/resistance indicators) can be used to determine the ZL? Is this true? In the image es/pip posted it seems like it can be.. where the yellow line starts -- that candle has a 'dot' where resistance is and once broken, becomes the ZL. Comments?
correct---the blue area is the z area---the yellow line is where the held profit is from and labels are entries and exits
i can not comment on the dyn s/r = zlines, as i have not looked at it


Please add www.kreslik.com to your ad blocker white list.
Thank you for your support.
Thank you for your support.
pierre23 wrote:In your AUD/USD trade above, what is the 'z area' used for if the ZL is below it? I thought you were just using the ZL - body in direction of profit, and a wicking of the ZL then entering a trade??
Or are you now waiting for that wick in direction of loss to cross into that blue area first?
this is a bad example for this explanation bec the zline(the one i marked for a reference point for the held profit) is not in the blue mighty zone
but
i mark my mighty zone and then, any line inside that area can be a zline--or reference point---this one just came up a tad bit before it----- but at the same time that is where the held profit is originating from----well the way i see it it is
no matter
i still need body in direction of profit and wick in direction of loss
again
wheni throw an order out at my reference point i am only doing that with 1/4 or 1/3 position---so if i get stopped for -20 or whatever it is really only -5-8 and then i will add into it
not sure if that answered your q or not
edit------ not add into my loser--- if i get stopped i get stopped--- when i say add in i mean when it goes my way
retarded 
i am going to bed for two reasons
1. i had a nice week--- tonight
2. i have put down enough whiskey to drown a small water buffalo
some of my targets hold within a pip some get blown thru like they were never even there
going to start selling half positions at target and trying to get out the rest off the tape or when it slightly starts to turn------ when i get half filled at target i will bail on other half---if it doesn't rip thru, as soon as i can get out


es/pip wrote:MightyOne wrote:Shadik wrote:Omg Im so stupid. I looked once again on Es charts and I now see more than before.
MO, yours ZL are wonderful.
I see now how I was stupid
I have one question if its true I going kill my self because I was very very blind and stupid. ( With kill my self i kidding:) )
I looking right now on this ES's chart:
Tro, MO, Dragon and ES thank you again and again for this all - it was very useful. Im happy - no, im very happy to be here and read your post again and again:) You are wonderful people. I hope meet more people like u all in my life.
THX
ps. I have to learn more english:)
I trade in the direction of profit after price enters the Mighty Zone or I trade with candle color, above the momentum bar, as price decides to take off.
es / pip trades in his own way, Dragon trades in another, and I trade in yet another and none of us are wrong if it works out.
Just in case there is any confusion as to what an entry is I will define it for you:
An entry is timing when momentum will carry you into profit within
the time period that your risk is calculated from.
MO,
On my chart once you enter the zone on bar #2, that bar in fact closes as an up bar with a wick in direction of loss. When you say, "I trade in the direction of profit after price enters the Mighty Zone" Do you consider bar # 2 " in the direction of profit", it is in fact moving in the direction of profit even though it is an up bar.
Or do you consider, "I trade in the direction of profit after price enters the Mighty Zone", to be bar # 3 bec it is a new bar and is moving and the same color as direction of profit.
thanks
edit-----i meant to do this on a 5 min chart---- just pretend my example is a 5 min chart

Think of moving into the Mighty Zone as a DFSR trade only instead of making a new high or low price moves into the zone but does not close in the zone (wick in the direction of loss).
Remember that a body in the direction of profit is based on a momentum candle and not a doji
MightyOne wrote:es/pip wrote:MightyOne wrote:Shadik wrote:Omg Im so stupid. I looked once again on Es charts and I now see more than before.
MO, yours ZL are wonderful.
I see now how I was stupid
I have one question if its true I going kill my self because I was very very blind and stupid. ( With kill my self i kidding:) )
I looking right now on this ES's chart:
Tro, MO, Dragon and ES thank you again and again for this all - it was very useful. Im happy - no, im very happy to be here and read your post again and again:) You are wonderful people. I hope meet more people like u all in my life.
THX
ps. I have to learn more english:)
I trade in the direction of profit after price enters the Mighty Zone or I trade with candle color, above the momentum bar, as price decides to take off.
es / pip trades in his own way, Dragon trades in another, and I trade in yet another and none of us are wrong if it works out.
Just in case there is any confusion as to what an entry is I will define it for you:
An entry is timing when momentum will carry you into profit within
the time period that your risk is calculated from.
MO,
On my chart once you enter the zone on bar #2, that bar in fact closes as an up bar with a wick in direction of loss. When you say, "I trade in the direction of profit after price enters the Mighty Zone" Do you consider bar # 2 " in the direction of profit", it is in fact moving in the direction of profit even though it is an up bar.
Or do you consider, "I trade in the direction of profit after price enters the Mighty Zone", to be bar # 3 bec it is a new bar and is moving and the same color as direction of profit.
thanks
edit-----i meant to do this on a 5 min chart---- just pretend my example is a 5 min chart
Think of moving into the Mighty Zone as a DFSR trade only instead of making a new high or low price moves into the zone but does not close in the zone (wick in the direction of loss).
Remember that a body in the direction of profit is based on a momentum candle and not a doji
k
with ya
thanks
Please add www.kreslik.com to your ad blocker white list.
Thank you for your support.
Thank you for your support.