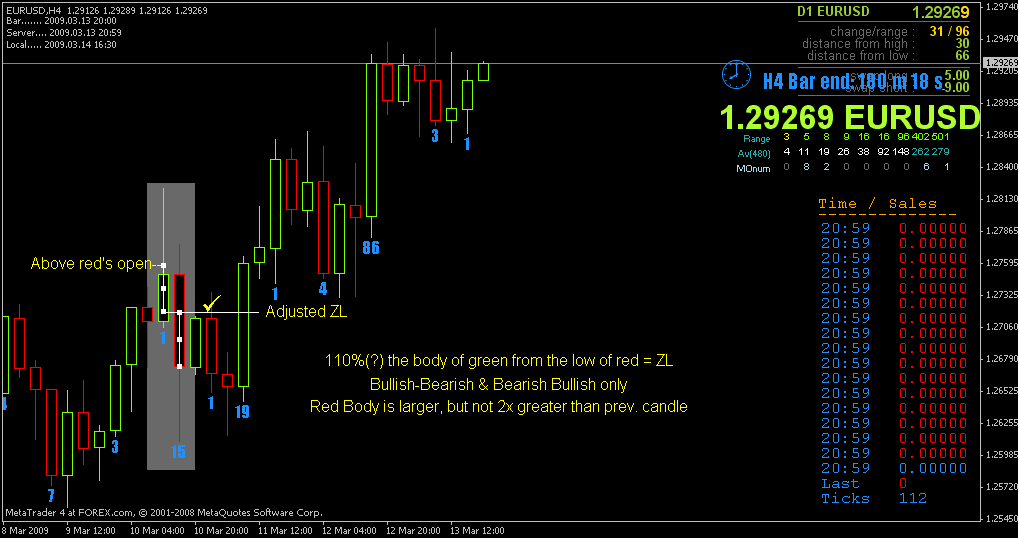
"First trade:
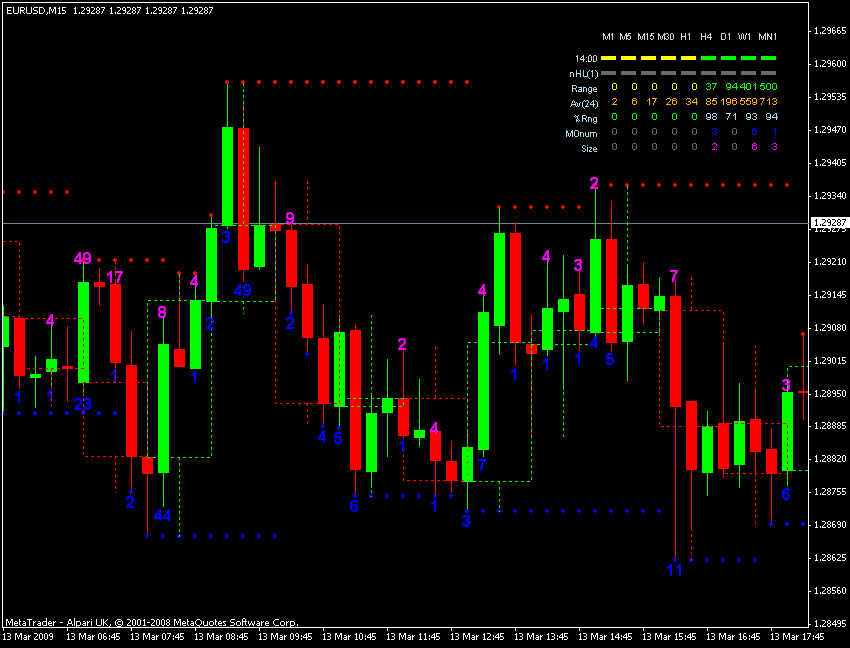
After forming a new high there is a candle down with a bigger body marked with red number one.(be carefull it is not twice as big as previous) get ready there is a possibility. It is a body in direction of profit.
The green candle marked number two goes back up but body closes around zero line and has a big wick in direction of loss. "
I think I see why I was having a hard time.
When you say "wick in direction of loss", what you are saying is the wick FORMED in the direction of loss!!
In this case, the price went up and reversed, thus FORMING A WICK IN THE DIRECTION OF LOSS. Now, I understand.