You could just say the FIRST close of a candle AFTER a reversal. Technically though, according to what your saying, any close of a candle during a trend is a z-line.
MightyOne wrote:
If you see a breakout and you can imagine yourself sitting with profit after moving your stops to BE then that is a ZL line.
NOTE: most experienced traders trade before the actual breakout of the extreme and take partial profits on BO.
Support and resistance just means that the money ran out in the direction being traded and for the size of the traders being targeted at that moment.
So, my green lines are S/R lines and your yellow lines are Z-lines.
Ok. TRO says no right or wrong.
Your profitable/ I'm not.
I say that's being wrong.
I'll try it Monday.
Never Lose Again
Moderator: moderators
-
prochargedmopar

- rank: 10000+ posts

- Posts: 12048
- Joined: Sat Dec 20, 2008 6:07 am
- Reputation: 1790
- Location: Granbury, TX
- Gender:

- Contact:
#1BODY in direction of profit #2INCREASE lot size Obsessively
My Losses cause me Great Laughter!
Trading Bible here> therumpledone/the-ideas-that-i-trade-by-t3256/page1670
My Losses cause me Great Laughter!
Trading Bible here> therumpledone/the-ideas-that-i-trade-by-t3256/page1670
Please add www.kreslik.com to your ad blocker white list.
Thank you for your support.
Thank you for your support.
-
prochargedmopar
- rank: 10000+ posts
- Posts: 12048
- Joined: Sat Dec 20, 2008 6:07 am
- Reputation: 1790
- Location: Granbury, TX
- Gender:
- Contact:
Thankyou sir,
Price moves from entries to exits and back to entries;
exit on extremes, enter on stops, exit on extremes.
In context of a reversal and subsequent trend,
Entries= wicks in direction of loss and body in direction of profit.
Exits=retrace of second wick
entries=close of body in profit or body itself
Exit on extremes=???
Enter on stops= formation of first wick
Exit on extremes= formation/retrace of second wick
I've been banging my head over that statement.
Only greenbacks Monday will give an indication if I can SEE.
BTW, how did you find that? I've got 500+pages printed out (More actually) and couldn't find it. Also Kreslik will only let me scroll one page at a time.
#1BODY in direction of profit #2INCREASE lot size Obsessively
My Losses cause me Great Laughter!
Trading Bible here> therumpledone/the-ideas-that-i-trade-by-t3256/page1670
My Losses cause me Great Laughter!
Trading Bible here> therumpledone/the-ideas-that-i-trade-by-t3256/page1670


prochargedmopar wrote:From what I SEE this will only work in a 2ish-candle trending market.
Consolidation and your dead. This is war isn't it?
I've been trying to figure out a way to ride the bodies and wick extension for a while. This is it.
Way back when Mightyone said:"*"
Dang, wish I could find what he told his friends about this......
entering on ???/exiting on extremes,.......
Mightyone, please re-post that as I can't find the printout of what you stated.
I will jump ship at every candle that starts to reverse against direction of profit. Wait on it to start wick formation or just until the body in direction of profit starts to form. It's only 1.5-2 pips to get back in and you don't have to sit through much draw down. Do this only if the bodies are still of sufficient size. Would make the long runs easier to stomach.
Granted you'll leave some on the table and have some losses but that's a lot better than missing a 100+pip run as I do regularly.
es/pip
See what the human see's?
A computer would only have to see a bodies close "after" a trend reversal. Trend would be subjective and would have to be set up with ma crossovers or something like that.
Me thinks anyway.
That's like all those candle patterns I listed above. They are crap and do not work if there is not a prior trend. In small box ranges, triangles, flags, consolidation, they show only a neutral or refreshing market sentiment.
Procharged
Price is always trending based on a time period and price is always congesting based on another.
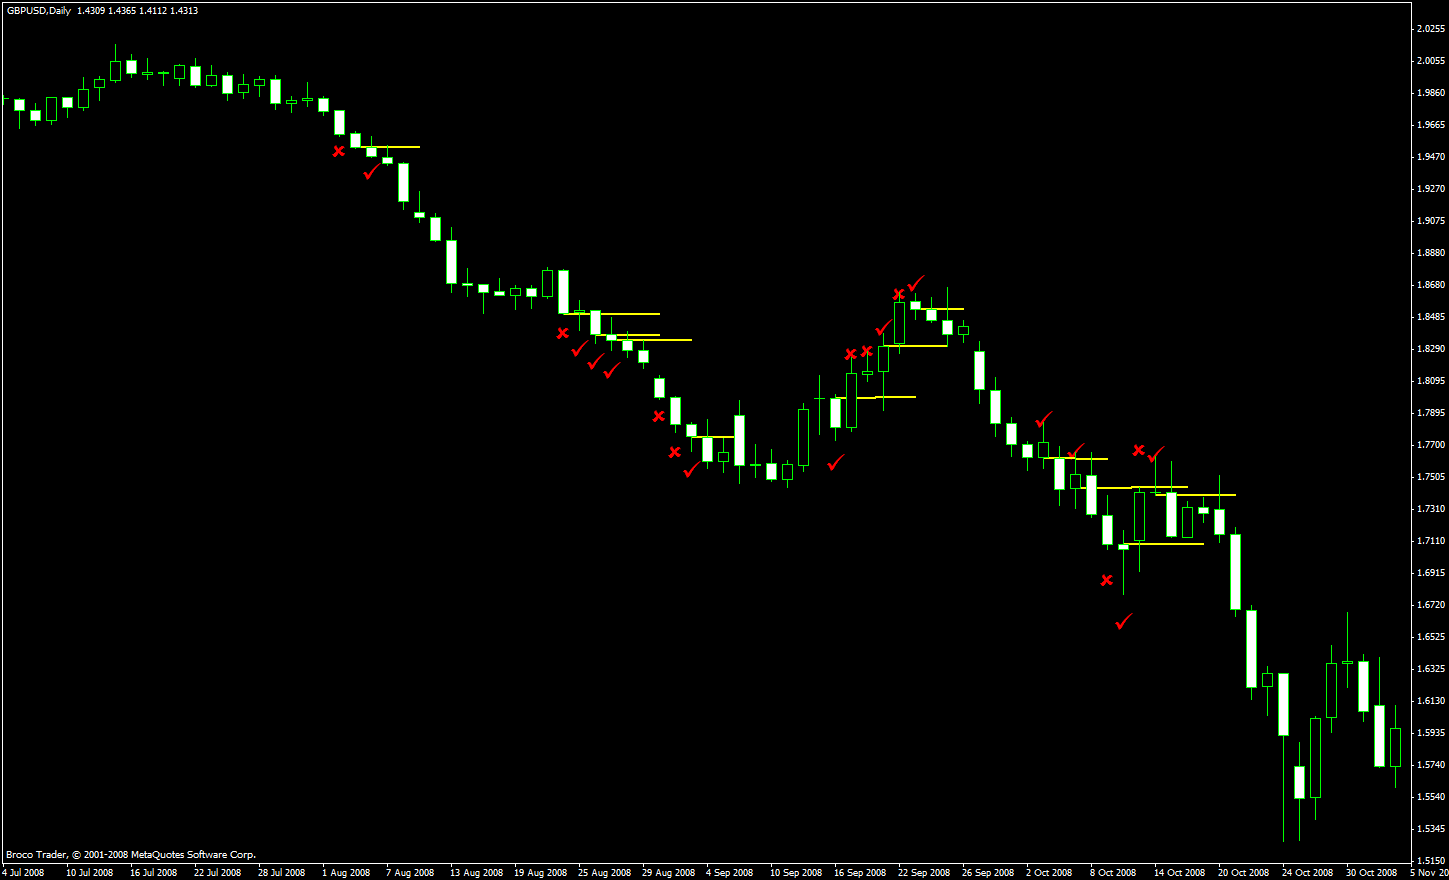
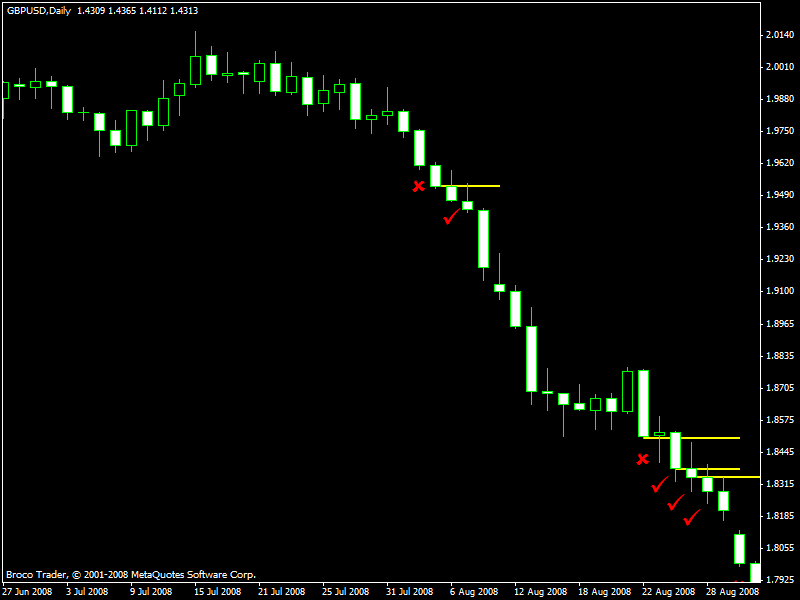
HELD PROFIT CREATES A ZERO LINE BECAUSE A ZERO LINE IS WHERE TRADERS ARE LIKELY TO BE ZEROED OUT OF PROFIT.
If price did not go any where then how can you assume that traders entered?
If price did go some where and the body closed the same size or smaller than the previous body then how can you assume that traders held onto profit?
How can you possibly expect to reach 100 pips profit if you know nothing about position trading?
The likely out come is that you will be another trader holding onto profit and getting zeroed out.
As I said before it is the trader who makes one system greater than another.
Maybe Zero Lines are just not in line with your personality...
Last edited by MightyOne on Sun Mar 01, 2009 7:02 pm, edited 1 time in total.


prochargedmopar wrote:You could just say the FIRST close of a candle AFTER a reversal. Technically though, according to what your saying, any close of a candle during a trend is a z-line.
MightyOne wrote:
If you see a breakout and you can imagine yourself sitting with profit after moving your stops to BE then that is a ZL line.
NOTE: most experienced traders trade before the actual breakout of the extreme and take partial profits on BO.
Support and resistance just means that the money ran out in the direction being traded and for the size of the traders being targeted at that moment.
So, my green lines are S/R lines and your yellow lines are Z-lines.
Ok. TRO says no right or wrong.
Your profitable/ I'm not.
I say that's being wrong.
I'll try it Monday.
i dont think there is nec. a right or wrong
i guess it really comes down to how each person sees it
You could just say the FIRST close of a candle AFTER a reversal. Technically though, according to what your saying, any close of a candle during a trend is a z-line.
ehhhhh---------- no not so much
this may be a bad example being a daily chart bec i can see the transfer ship of buyers and sellers inside those formations
but not every bar creates a zline------ where did people get long or get short?
i really think i am starting to hurt more than helping anyone
es/pip wrote:prochargedmopar wrote:You could just say the FIRST close of a candle AFTER a reversal. Technically though, according to what your saying, any close of a candle during a trend is a z-line.
MightyOne wrote:
If you see a breakout and you can imagine yourself sitting with profit after moving your stops to BE then that is a ZL line.
NOTE: most experienced traders trade before the actual breakout of the extreme and take partial profits on BO.
Support and resistance just means that the money ran out in the direction being traded and for the size of the traders being targeted at that moment.
So, my green lines are S/R lines and your yellow lines are Z-lines.
Ok. TRO says no right or wrong.
Your profitable/ I'm not.
I say that's being wrong.
I'll try it Monday.
i dont think there is nec. a right or wrong
i guess it really comes down to how each person sees it
You could just say the FIRST close of a candle AFTER a reversal. Technically though, according to what your saying, any close of a candle during a trend is a z-line.
ehhhhh---------- no not so much
this may be a bad example being a daily chart bec i can see the transfer ship of buyers and sellers inside those formations
but not every bar creates a zline------ where did people get long or get short?
i really think i am starting to hurt more than helping anyone

Keep posting pictures like that and I will disown you
Please add www.kreslik.com to your ad blocker white list.
Thank you for your support.
Thank you for your support.

-
prochargedmopar
- rank: 10000+ posts
- Posts: 12048
- Joined: Sat Dec 20, 2008 6:07 am
- Reputation: 1790
- Location: Granbury, TX
- Gender:
- Contact:
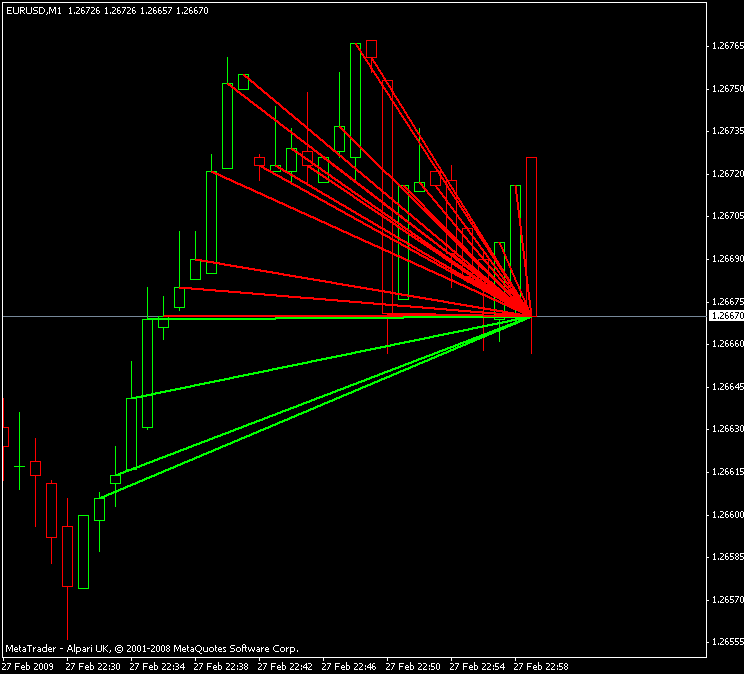
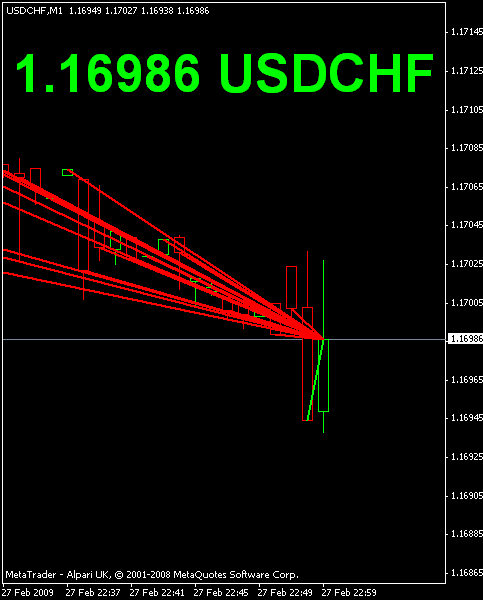
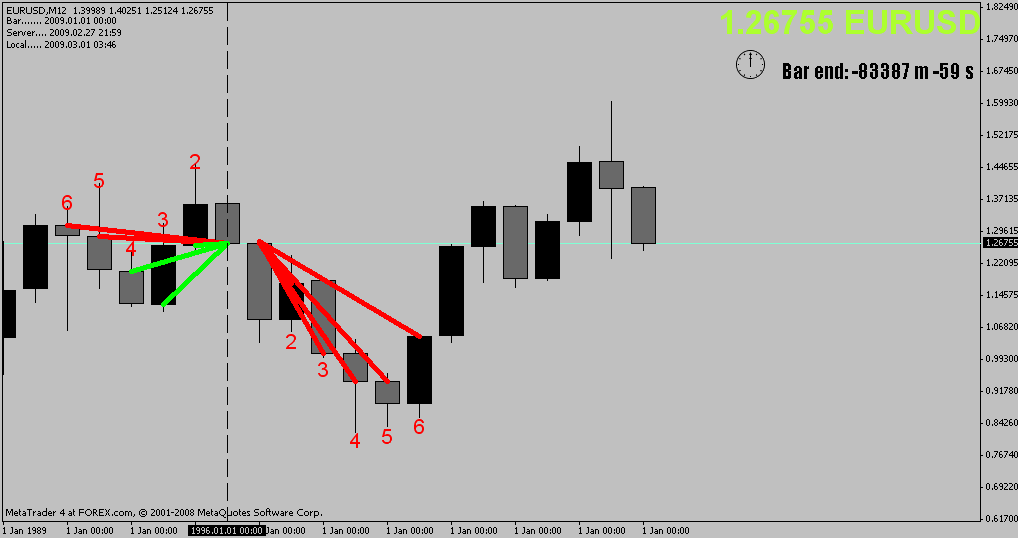
es/pip
Second pic/not first(oops)
according to what your yellow lines represented, the lines come from a Zero line of .26755
All consecutive numbered candles make up a single 72min candle.
Second pic/not first(oops)
according to what your yellow lines represented, the lines come from a Zero line of .26755
All consecutive numbered candles make up a single 72min candle.
#1BODY in direction of profit #2INCREASE lot size Obsessively
My Losses cause me Great Laughter!
Trading Bible here> therumpledone/the-ideas-that-i-trade-by-t3256/page1670
My Losses cause me Great Laughter!
Trading Bible here> therumpledone/the-ideas-that-i-trade-by-t3256/page1670
Please add www.kreslik.com to your ad blocker white list.
Thank you for your support.
Thank you for your support.