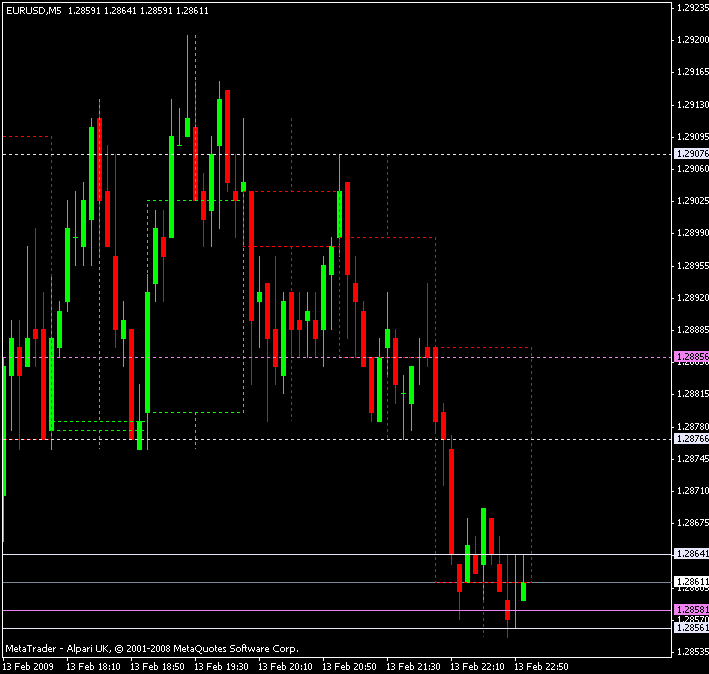
Never Lose Again
Moderator: moderators
- TheRumpledOne
- rank: 10000+ posts
- Posts: 15558
- Joined: Sun May 14, 2006 9:31 pm
- Reputation: 3035
- Location: Oregon
- Real name: Avery T. Horton, Jr.
- Gender:
- Contact:
Please add www.kreslik.com to your ad blocker white list.
Thank you for your support.
- blubbb
- rank: 150+ posts
- Posts: 219
- Joined: Mon Sep 29, 2008 8:07 pm
- Reputation: 0
- Location: Europe
- Gender:
Thanks for the link. I'm reading another book about this topic at the moment. Which actually was the reason why I was so startled by the first answer.
I have a theory why there are so many people trying out different systems with no luck, why backtesting them with fixed TPs and SLs doesn't work and why so many traders believing in different strategies bash each other so often (even or because of their own systems work for them).
It's not so much about the entries. A system is always designed to make you jump long into the market when it's likely going up and short when it's likely going down. If you paint a horizontal entry line *somewhere* on your chart, the price doesn't know that. Price can either move away from it (no trade) or it crosses it. When price has moved all the way to your line, is it likely it will stop at this line? Right at this line? Not very. So this is why TRO's approach works.
The only problem is (with all systems): What happens after the entry? There is still some noise in the market. So it may go wrong 2 pips once in a while, then it comes back. Maybe that "wave" which we see in the M1 charts has finished and needs some swing in the other direction to come back further. Or maybe you had bad luck and price is exhausted.
As a beginner you cannot tell those things apart... so you are confused and look for another system. Which again doesn't work for the same reason: Because the whole thing is not about the entries, but just about what happens between entry and exit. And traders that are consistent maybe don't even feel that because for them trading is so automated like riding a bike.
Just a theory. Maybe I could make it a bit clearer why I'm so interested in seeing some "professionally" lost trades.
- TheRumpledOne
- rank: 10000+ posts
- Posts: 15558
- Joined: Sun May 14, 2006 9:31 pm
- Reputation: 3035
- Location: Oregon
- Real name: Avery T. Horton, Jr.
- Gender:
- Contact:
"Because the whole thing is not about the entries, but just about what happens between entry and exit."
IT'S ALL ABOUT THE ENTRY... a poorly timed entry means no chance to take profit. A poorly timed exit means you may have missed your chance to take profit.
IT'S NOT WHAT YOU TRADE, IT'S HOW YOU TRADE IT!
Please do NOT PM me with trading or coding questions, post them in a thread.
- razorboy
- rank: 500+ posts
- Posts: 627
- Joined: Tue Oct 21, 2008 2:06 am
- Reputation: 0
- Location: Toronto
- Gender:
- Contact:
off topic.......sort of
has anyone tried running mt4 and a forex platform on a Netbook? I know the screen is small, but I can live with that when I travel
- prochargedmopar
- rank: 10000+ posts
- Posts: 12048
- Joined: Sat Dec 20, 2008 6:07 am
- Reputation: 1790
- Location: Granbury, TX
- Gender:
- Contact:
I've been thinking seriously about buying that $259 acer for when I'm out and about. I just bought a 24" flat panel and new home computer this week as I've been using my laptop and an old 17" monitor for about 3 weeks now.
I agree, it is all about the ENTRY. Friday I had 12 exits and the most neg pips I saw when in a trade was 8-9 pips on 1 only. The others never went below -2.5 pips including spread. That was refreshing and much less stressing.
Ok, I'm gonna stop filling this thread with needless newbie chatter and get back to reading. I was checking this link and others on my phone at the chinese buffet during valentines dinner.
#1BODY in direction of profit #2INCREASE lot size Obsessively
My Losses cause me Great Laughter!
Trading Bible here> therumpledone/the-ideas-that-i-trade-by-t3256/page1670
My Losses cause me Great Laughter!
Trading Bible here> therumpledone/the-ideas-that-i-trade-by-t3256/page1670
Please add www.kreslik.com to your ad blocker white list.
Thank you for your support.
- razorboy
- rank: 500+ posts
- Posts: 627
- Joined: Tue Oct 21, 2008 2:06 am
- Reputation: 0
- Location: Toronto
- Gender:
- Contact:
Power Law
Read the last paragraph of the first column of the Second page. I suspect that there is an indicator to be built with those stats. Fractals vs Bell Curve.......
http://www.fooledbyrandomness.com/fortune.pdf
TRO - is there any way to modify your range count plug ins to differentiate between positive and negative moves
http://www.fooledbyrandomness.com/fortune.pdf
TRO - is there any way to modify your range count plug ins to differentiate between positive and negative moves
blubbb wrote:I have a strange request. Some of you "pros" already posted a lot of winning trades. I'd like to see some of your losing ones as well. If a trade goes into into the right direction right from the start, it's not really difficult to be profitable... But we all know that we have to take losses as well. So I'm interested in (maybe M1) charts where you had to make the decision when to stop.
I would like to do that but on the other side it is difficult to show losing trades when you don't make them much. But when i do i will post them.
When we trade we don't want to lose and we are faster then newbies we don't make a problem cutting a trade with just 1 pip. Entry in the right direction is simple but taking profit is different to all of us. I'm happy with 5 pips maybe you don't and that's the way some people keep losing there trades.
TheRumpledOne wrote:Sledge100 wrote:TheRumpledOne wrote:Sledge, which platform... MT4, TradeStation or eSignal?
TRADERS: IF YOU HAVE A QUESTION ABOUT AN INDICATOR, PLEASE POST A CHART SHOWING THAT INDICATOR AND POST THE EXACT NAME OF THE INDICATOR.
I think I have written over 1,000 indicators, so please help me help you.
TRO-
It is the TRO_DYNAMIC_FIBS_SR Indicator.
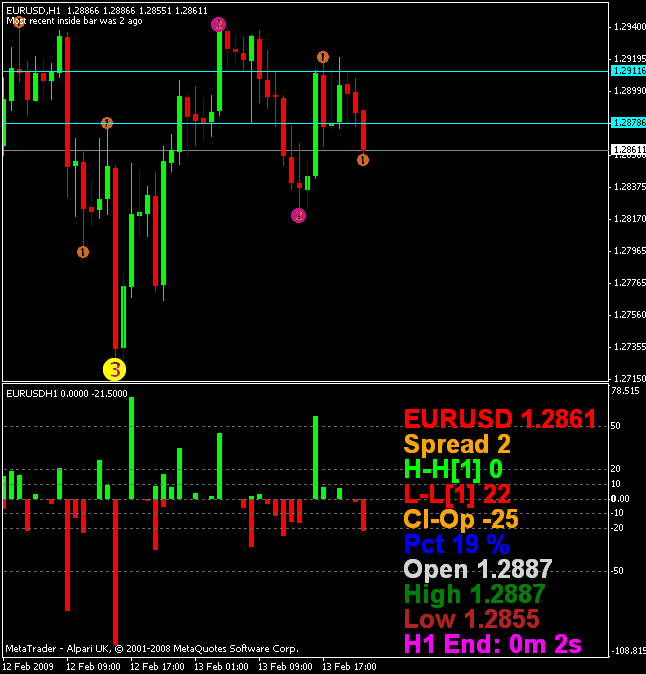
The one that draws the Support and Resistance Dots and produces Buy and Sell Lines. On the picture I posted you can see the sell line- the Buy Line is way out of the 1 hr chart.
My questions are:
1. The lines will move as the market moves. What triggers in the indicator to produce a move of the Buy or Sell line on a chart?
2. Same question with a Dot. If you look at a support line of dots as an example- you see a long row at the bottom at about 1.4715. At 1.4890 you see that a new blue dot forms at the bottom of the bar.
With both questions I'm probably seeking the same answer (Thanks in advance) What does the indicator "see" that prompts:
A. The Buy Sell Lines to shift
B. That particular bar, to now have a blue dot below it?
Hope this is a descriptive enough set of questions.
Thanks
Aaron
TRO_DYNAMIC_FIBS_SR doesn't plot lines.
Look at the code if you want to know how it works. It looks at the highest high/lowest low for the number of bars you tell it to analyze.
Bur, you do NOT need to know how it works to learn how to use it. It's like driving a car vs being an auto mechanic.
TRO-
I'm confused, when I use this indicator it plots me Buy and Sell Lines and also plots me the Support and Resistance Dots (Red and Blue) As shown on my chart I posted. I'm not real good with code, so thus my asking. Since you wrote the code and created the indicator, I thought maybe you could offer some insight as to what parameters were used for the creation of the signals. At some point the long line of support dots at the bottom will become invalid and the dot will "pop" up to a new level on a bar that formed, just wondering how the indicator determines THAT particular bar is the one that creates new support (and thus assigning it a support dot) Thanks.
Aaron
- TheRumpledOne
- rank: 10000+ posts
- Posts: 15558
- Joined: Sun May 14, 2006 9:31 pm
- Reputation: 3035
- Location: Oregon
- Real name: Avery T. Horton, Jr.
- Gender:
- Contact:
Aaron
On the chart you posted, I don't see any buy/sell lines. All I see are the SR dots.
Post your template. So I can see what you see.
It looks at the highest high/lowest low for the number of bars you tell it to analyze. That's how it determines where to place the dots.
On the chart you posted, I don't see any buy/sell lines. All I see are the SR dots.
Post your template. So I can see what you see.
It looks at the highest high/lowest low for the number of bars you tell it to analyze. That's how it determines where to place the dots.
IT'S NOT WHAT YOU TRADE, IT'S HOW YOU TRADE IT!
Please do NOT PM me with trading or coding questions, post them in a thread.
- TheRumpledOne
- rank: 10000+ posts
- Posts: 15558
- Joined: Sun May 14, 2006 9:31 pm
- Reputation: 3035
- Location: Oregon
- Real name: Avery T. Horton, Jr.
- Gender:
- Contact:
MORE ON ZERO LINES (continued)
Years ago, when I was using TradeStation, someone introduced to me the concept of "battle lines" and explained trading in war terms. That led me to develop the GRIDIRON.
I was pondering zero lines and remembered battle lines.
GREEN CANDLE - high is buyer's advance, close is buyer's retreat.
RED CANDLE - low is seller's advance, close is seller's retreat.
So I wrote TRO_AdvanceRetreat to mark those "battle lines".
The M5 chart above has the H1 candle shawdow( dotted lines ).
TRO_AdvanceRetreat ( M5, 1 BAR AGO SOLID LINES )
TRO_AdvanceRetreat ( H1, 1 BAR AGO DOTTED LINES )
So what happened during the last H1 candle on the chart?
Sellers had retreated (1.2885), rested and made another push forward.
Sellers pushed past previous advance point(1.2876).
Buyers stopped the sellers(1.2855) and have caused seller to retreat(1.2861).
Does that help you to SEE?
FREE MT4 version of TRO_ADVANCE_RETREAT, including SOURCE CODE and template) attached.
- Attachments
-
- TRO_AdvanceRetreat.zip
- (20.06 KiB) Downloaded 377 times
IT'S NOT WHAT YOU TRADE, IT'S HOW YOU TRADE IT!
Please do NOT PM me with trading or coding questions, post them in a thread.
Please add www.kreslik.com to your ad blocker white list.
Thank you for your support.