1. there is a breakout
2. the range of the breakout candle becomes => than the prev. candle
3. price closes by at least x above the breakout.
4. Age your zero line: After step 3, put a 1 above prev. candle and increase this number every time there is an additional close above the ZL without price returning to it.
5. destroy on impact or use dots that end after impact so chart does not become a mess.
Never Lose Again
Moderator: moderators
Please add www.kreslik.com to your ad blocker white list.
Thank you for your support.
Thank you for your support.
- TheRumpledOne
- rank: 10000+ posts

- Posts: 15558
- Joined: Sun May 14, 2006 9:31 pm
- Reputation: 3035
- Location: Oregon
- Real name: Avery T. Horton, Jr.
- Gender:

- Contact:
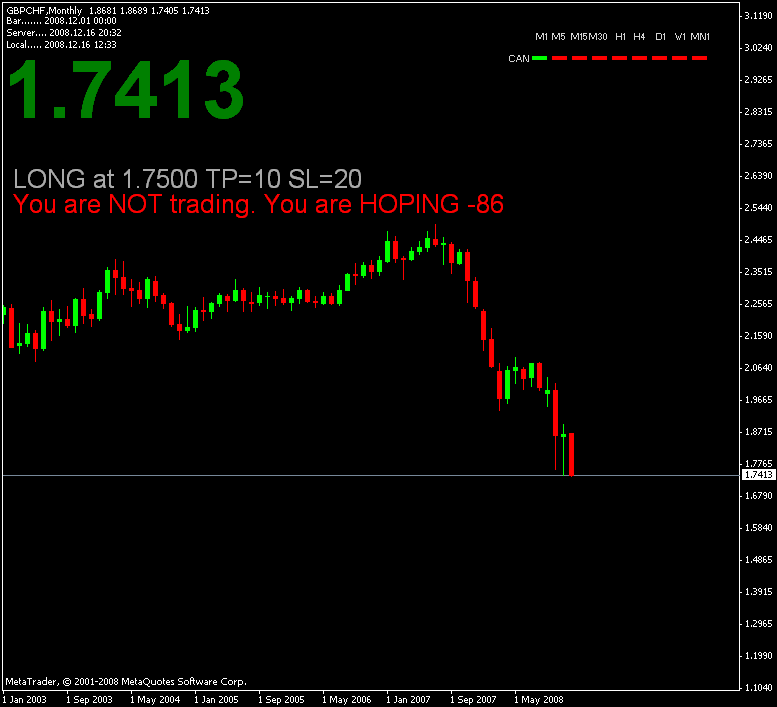
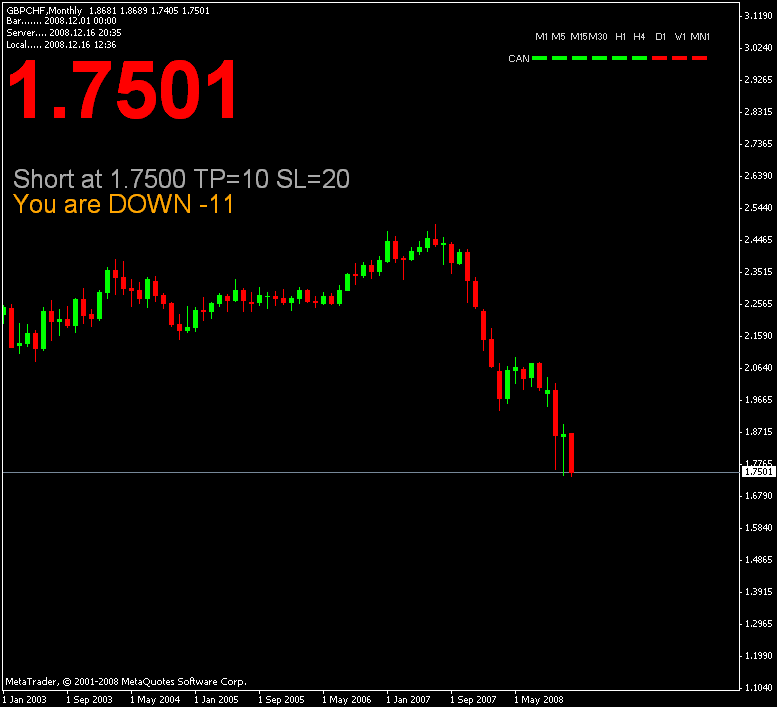
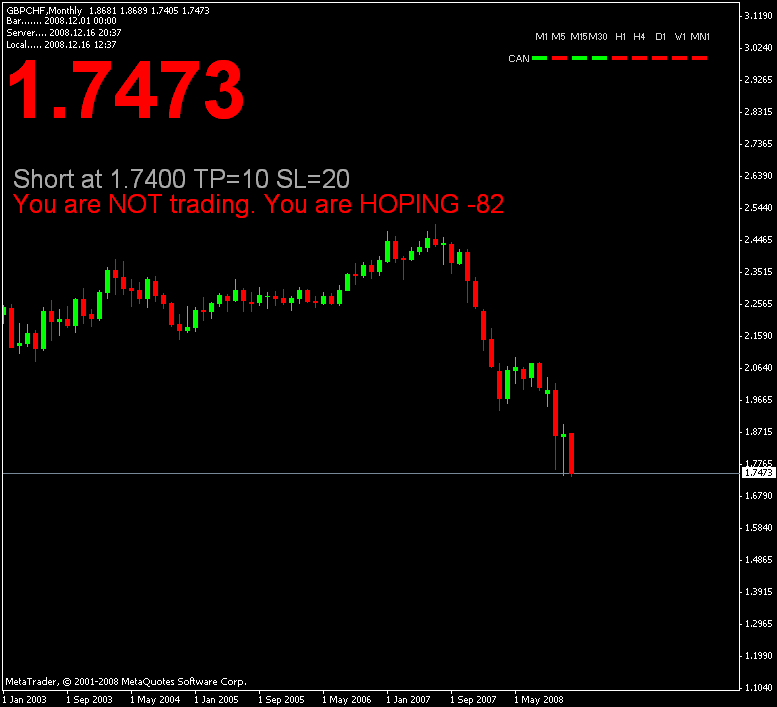
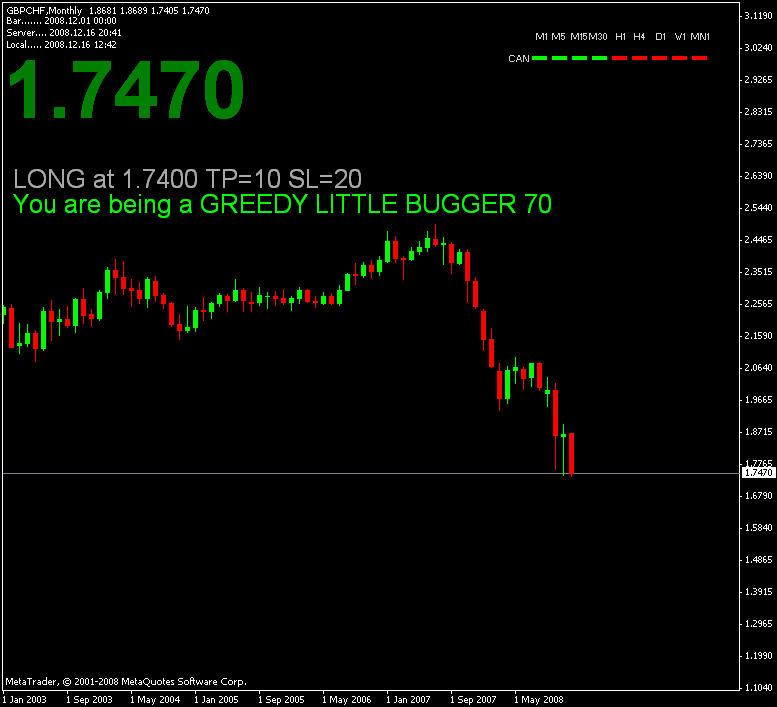
TRO_TRADE_MANAGER


I had written the TRO TRADE MANAGER for TradeStation.
You tell TRO TRADE MANAGER your entry, entry direction, TP and SL. TRO TRADE MANAGER will tell you how the trade is going. It also shows how many pips you are up or down.
TRO TRADE MANAGER use BID price if you are LONG and ASK if you are SHORT to calculate the profit/loss.
Also, all of the messages are INPUTS, so you can change them to your liking.
Last edited by TheRumpledOne on Tue Dec 16, 2008 7:58 pm, edited 2 times in total.
IT'S NOT WHAT YOU TRADE, IT'S HOW YOU TRADE IT!
Please do NOT PM me with trading or coding questions, post them in a thread.
Please do NOT PM me with trading or coding questions, post them in a thread.
- razorboy
- rank: 500+ posts

- Posts: 627
- Joined: Tue Oct 21, 2008 2:06 am
- Reputation: 0
- Location: Toronto
- Gender:

- Contact:
Good old fashion "X"
I think (notice I said I think) another way to capture this concept is to use 2 or three sets of the fib lines and varying durations (say 4, 25 and 50 periods - put the 4 and the 50 on one chart, the 25 on another) obviously using the same currency and time frame. Seem to me to be an excellent way to visualize "air" between the different levels of resistance and support of different time frames
Alternatively, it lets you know how much you can scalp into support or resistance.
MightyOne wrote:1. there is a breakout
2. the range of the breakout candle becomes => than the prev. candle
3. price closes by at least x above the breakout.
4. Age your zero line: After step 3, put a 1 above prev. candle and increase this number every time there is an additional close above the ZL without price returning to it.
5. destroy on impact or use dots that end after impact so chart does not become a mess.
razorboy wrote:Good old fashion "X"
I think (notice I said I think) another way to capture this concept is to use 2 or three sets of the fib lines and varying durations (say 4, 25 and 50 periods - put the 4 and the 50 on one chart, the 25 on another) obviously using the same currency and time frame. Seem to me to be an excellent way to visualize "air" between the different levels of resistance and support of different time frames
Alternatively, it lets you know how much you can scalp into support or resistance.MightyOne wrote:1. there is a breakout
2. the range of the breakout candle becomes => than the prev. candle
3. price closes by at least x above the breakout.
4. Age your zero line: After step 3, put a 1 above prev. candle and increase this number every time there is an additional close above the ZL without price returning to it.
5. destroy on impact or use dots that end after impact so chart does not become a mess.
You could set x to zero, but the idea is to trade to the zero line when there is x profit that you feel is enough to trade for.
Another thing that adds value to a ZL is its age; like a fine bottle of wine traders salivate when they see longer term traders holding their huge profits.
The x does not change the fact that it is a zero line!
That said if you want to use fibs then use fibs
I do my own thing like every one else...
(Not saying that I would not like to see a picture of what you are talking about and price reacting in the same way)
TheRumpledOne wrote:TRO_TRADE_MANAGER
I had written the TRO TRADE MANAGER for TradeStation.
You tell TRO TRADE MANAGER your entry, entry direction, TP and SL. TRO TRADE MANAGER will tell you how the trade is going. It also shows how many pips you are up or down.
TRO TRADE MANAGER use BID price if you are LONG and ASK if you are SHORT to calculate the profit/loss.
Also, all of the messages are INPUTS, so you can change them to your liking.
LoL!
I will use it, it will help to pass the time
Please add www.kreslik.com to your ad blocker white list.
Thank you for your support.
Thank you for your support.
- TheRumpledOne
- rank: 10000+ posts

- Posts: 15558
- Joined: Sun May 14, 2006 9:31 pm
- Reputation: 3035
- Location: Oregon
- Real name: Avery T. Horton, Jr.
- Gender:

- Contact:
MightyOne wrote:1. there is a breakout
2. the range of the breakout candle becomes => than the prev. candle
3. price closes by at least x above the breakout.
4. Age your zero line: After step 3, put a 1 above prev. candle and increase this number every time there is an additional close above the ZL without price returning to it.
5. destroy on impact or use dots that end after impact so chart does not become a mess.
For number 2, wouldn't you just wait for the current price to be above the breakout price by more than the range of the previous candle at the breakout?
I am thinking the modification to my TRO_SupResHHLL is pretty close to this.... Hmmmm.....
IT'S NOT WHAT YOU TRADE, IT'S HOW YOU TRADE IT!
Please do NOT PM me with trading or coding questions, post them in a thread.
Please do NOT PM me with trading or coding questions, post them in a thread.
Cut the current => prev. range out if you want to, but don't force price to move the range above the breakout.
Breakout and price closes above breakout by x to start the age of the candle is fine.
You can even add the scalp if you want to which is a no close (age less) breakout.
Then again, it takes 12 seconds to draw them by hand which isn't a pain when the time sales is not deleting them
Yes, thank you for the update~!
PS: I actually stopped looking at 5 minute charts and watch time sales trends to place trades on candle color and it is magical.
I don't understand the time sales, how does it work and what are you looking for before you place a trade in a certain direction?
edit; Ok so when price changes up or down, it will display the price and the time when it changed. Second question still stands, what are you looking for and taking note of before placing a trade?
edit; Ok so when price changes up or down, it will display the price and the time when it changed. Second question still stands, what are you looking for and taking note of before placing a trade?
pierre23 wrote:
Ok so when price changes up or down, it will display the price and the time when it changed. Second question still stands, what are you looking for and taking note of before placing a trade?
That is a very good question Pierre and one that can be answered.
You use any of TRO's methods to look for a "situation" that signals a trade.
OBSERVE time & sales as things are going your way.
OBSERVE time & sales as things go wrong
OBSERVE what you call "stalling" and what time & sales are doing and then what happens after.
Can you guess what the theme of time and sales is?
OBSERVATION
If you are not willing to set it on the side of your chart and observe price for every entry candle that TRO sends your way then do your self a favor and take it off your chart!
I will give you a pointer in the next post
Time & Sales
Which way am I trading?
What is time and sales doing?
What is time and sales doing?
Please add www.kreslik.com to your ad blocker white list.
Thank you for your support.
Thank you for your support.

