
TRO,
I have spent the last hour trying to locate your money management EXCEL sheet but could not find it.
Would you please be kind enough to post it here?
Thank you.
Khalid
Never Lose Again
Moderator: moderators
Please add www.kreslik.com to your ad blocker white list.
Thank you for your support.
Thank you for your support.


-
TheRumpledOne

- rank: 10000+ posts

- Posts: 15558
- Joined: Sun May 14, 2006 9:31 pm
- Reputation: 3035
- Location: Oregon
- Real name: Avery T. Horton, Jr.
- Gender:

- Contact:

I saw some of the traders on BabyPips were discussing how many times a price level occurred. I had written the TradeStation indicators for that years ago. So I wrote a MT4 version - TRO_PRICE_OCCURS.
IT'S NOT WHAT YOU TRADE, IT'S HOW YOU TRADE IT!
Please do NOT PM me with trading or coding questions, post them in a thread.
Please do NOT PM me with trading or coding questions, post them in a thread.
-
TheRumpledOne
- rank: 10000+ posts
- Posts: 15558
- Joined: Sun May 14, 2006 9:31 pm
- Reputation: 3035
- Location: Oregon
- Real name: Avery T. Horton, Jr.
- Gender:
- Contact:
khalid wrote:TRO,
I have spent the last hour trying to locate your money management EXCEL sheet but could not find it.
Would you please be kind enough to post it here?
Thank you.
Khalid
- Attachments
-
 MoneyManagementChart.xls
- (26 KiB) Downloaded 536 times
IT'S NOT WHAT YOU TRADE, IT'S HOW YOU TRADE IT!
Please do NOT PM me with trading or coding questions, post them in a thread.
Please do NOT PM me with trading or coding questions, post them in a thread.
-
TheRumpledOne
- rank: 10000+ posts
- Posts: 15558
- Joined: Sun May 14, 2006 9:31 pm
- Reputation: 3035
- Location: Oregon
- Real name: Avery T. Horton, Jr.
- Gender:
- Contact:
rjmann wrote:I took a quick look for him on investopedia, but I couldn't find him I'll look again here soon.
Can someone tell me or point to a place where I can find the calculations for price indicators for BZ_everyhour.
Long trigger = H1 Open + 3 or 4 pips.
Short trigger = H1 Open - 3 or 4 pips.
Long TP = H1 Open + 9 or 10 pips.
Short TP = H1 Open - 9 or 10 pips.
IT'S NOT WHAT YOU TRADE, IT'S HOW YOU TRADE IT!
Please do NOT PM me with trading or coding questions, post them in a thread.
Please do NOT PM me with trading or coding questions, post them in a thread.
Please add www.kreslik.com to your ad blocker white list.
Thank you for your support.
Thank you for your support.
-
TheRumpledOne
- rank: 10000+ posts
- Posts: 15558
- Joined: Sun May 14, 2006 9:31 pm
- Reputation: 3035
- Location: Oregon
- Real name: Avery T. Horton, Jr.
- Gender:
- Contact:
razorboy wrote:Cant disagree with you more actually
If you are just starting to acquire a skill - the basics and consistency are important. If you don't sit and observe, you wont learn. If you don't develop a basic competency in basic skills, you will never develop a good foundation. I can run 6 minute miles, well, because I run, over and over again - different paces, different distances, but I keep running - I could walk if all i was interested in was distance, but I want speed. Same thing as batting practice, same thing as swinging a golf club - over and over. Master the basics and then move on. Once you know what you are doing, then yes, there is more than one way to skin a cat, but for most retail forex traders, they would be lucky if they could find a cat to skin in the first place
I am willing to bet that without knowing which pair you are trading at the time, you would probably become much more consistent in your trading. Can you differentiate different stocks/currencies and commodities based on the pattern they trace out on a chart? I couldnt even tell the difference between a 1 hour and monthly chart unless it was labeled. Anyone want to post some random mystery charts and see who can accurately identify the chart and the time frame?
lets play........NAME THAT CHART............................
Look at Michal Kreslik's work regarding DECIMAL BIAS and you'll be able to NAME THAT CHART!!
IT'S NOT WHAT YOU TRADE, IT'S HOW YOU TRADE IT!
Please do NOT PM me with trading or coding questions, post them in a thread.
Please do NOT PM me with trading or coding questions, post them in a thread.
-
razorboy

- rank: 500+ posts

- Posts: 627
- Joined: Tue Oct 21, 2008 2:06 am
- Reputation: 0
- Location: Toronto
- Gender:
- Contact:
More fun with MTF and price
Having just read thru the nobrainer site and messed around with trading with and against hourly colors and the dynamic fib lines, what would be useful is an indicator that would plot support and resistance levels of a higher time frame on a lower time frame screen. This way you can see how often many times price bounces at a certain level and where the stop order accumulate.
i have tried to do this with the five minute and one minute charts
I take the one minute chart, set the custom candle to 5 minutes (this give me the 5 minute chart) and then set the dynamic fibs to 25 (which gives a look back period of 5 - 5 minute candles) - this really gives you an opportunity to watch price bounce off of support and resistance before it finally breaks through and makes a new high - buy on new high - close on ........well that is your call
you can obviously do this with other time frames - im just really impatient
TheRumpledOne wrote:
I saw some of the traders on BabyPips were discussing how many times a price level occurred. I had written the TradeStation indicators for that years ago. So I wrote a MT4 version - TRO_PRICE_OCCURS.
-
TheRumpledOne
- rank: 10000+ posts
- Posts: 15558
- Joined: Sun May 14, 2006 9:31 pm
- Reputation: 3035
- Location: Oregon
- Real name: Avery T. Horton, Jr.
- Gender:
- Contact:
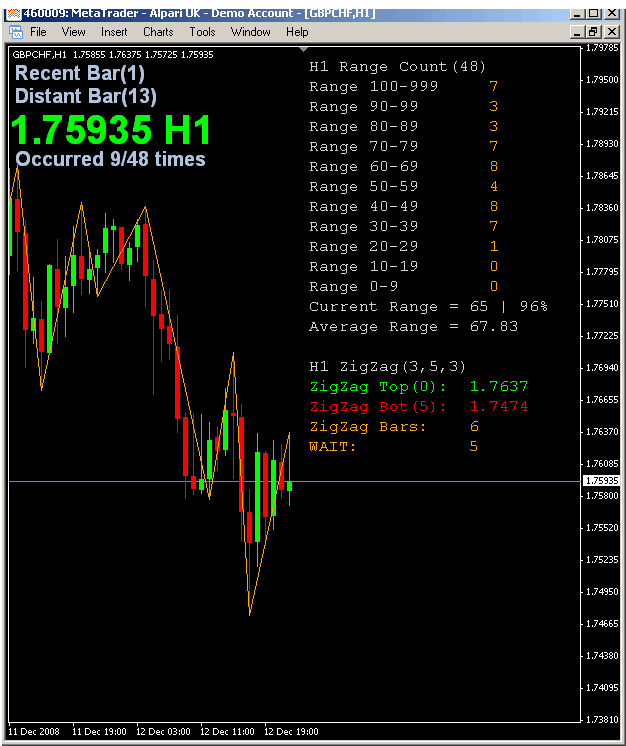
More fun looking at Zig Zag, Range and Price Occurring.
If price moves in "waves", then it has certain components:
Amplitude - Range or ( High - Low )
Frequency - Time between crest and trough.
Think about it, you enter a trade and price reverses on you...
How long could be the wait be before price returns to your entry level?
Michal Kreslik posted some statistics years ago.
What do you SEE?
IT'S NOT WHAT YOU TRADE, IT'S HOW YOU TRADE IT!
Please do NOT PM me with trading or coding questions, post them in a thread.
Please do NOT PM me with trading or coding questions, post them in a thread.
-
TheRumpledOne
- rank: 10000+ posts
- Posts: 15558
- Joined: Sun May 14, 2006 9:31 pm
- Reputation: 3035
- Location: Oregon
- Real name: Avery T. Horton, Jr.
- Gender:
- Contact:
Re: More fun with MTF and price
razorboy wrote:Having just read thru the nobrainer site and messed around with trading with and against hourly colors and the dynamic fib lines, what would be useful is an indicator that would plot support and resistance levels of a higher time frame on a lower time frame screen. This way you can see how often many times price bounces at a certain level and where the stop order accumulate.
i have tried to do this with the five minute and one minute charts
I take the one minute chart, set the custom candle to 5 minutes (this give me the 5 minute chart) and then set the dynamic fibs to 25 (which gives a look back period of 5 - 5 minute candles) - this really gives you an opportunity to watch price bounce off of support and resistance before it finally breaks through and makes a new high - buy on new high - close on ........well that is your call
you can obviously do this with other time frames - im just really impatient
All you have to do is change the number of bars the SR indicator is using on the M1 chart.
Remember, price is the SAME on all charts.
IT'S NOT WHAT YOU TRADE, IT'S HOW YOU TRADE IT!
Please do NOT PM me with trading or coding questions, post them in a thread.
Please do NOT PM me with trading or coding questions, post them in a thread.
-
TheRumpledOne
- rank: 10000+ posts
- Posts: 15558
- Joined: Sun May 14, 2006 9:31 pm
- Reputation: 3035
- Location: Oregon
- Real name: Avery T. Horton, Jr.
- Gender:
- Contact:

The strength (size) by which a currency can correct or congest is
about equal to the strength by which a currency can trend.
Since the MightOne has posted charts showing what PRICE could do, I added a couple of projection lines to the TRO_SupResHHLL indicator.
I simply added the range to the resistance level and subtracted the range from the support level.
Updated TRO_SupResHHLL indicator for MT4, including source code, attached.
P.S. There's a couple other treasures in the zip file for you pirates.
PLEASE DO NOT POST THESE INDICATORS ANYWHERE ELSE!
- Attachments
-
 TRO_SUPRESHHLL.zip
- (38.64 KiB) Downloaded 522 times
IT'S NOT WHAT YOU TRADE, IT'S HOW YOU TRADE IT!
Please do NOT PM me with trading or coding questions, post them in a thread.
Please do NOT PM me with trading or coding questions, post them in a thread.
Please add www.kreslik.com to your ad blocker white list.
Thank you for your support.
Thank you for your support.