noone, I can understand your frustration. now heres a simple example for you to ponder:
For a while I traded psycho lines(00,25,50,75). I found that the best trades were when price crossed a line (not closed over, just crossed) "with vigour" ie it hits the line with what is by eye a strong impulse- it need not move more than 2-4 pips to hit the line, these trades almost always went the distance to the next line, and I was rarely in drawdown long enough to look at exiting near b/e.
Now I'd like you to go and code this.... I couldnt, probably never will be able to....
I stopped trading this way because of the amount of screentime needed, thus should be a good candidate for automation.
G.
MO's MBT Micro
Moderator: moderators
-
bredin

- rank: 1000+ posts

- Posts: 1033
- Joined: Mon Feb 16, 2009 10:41 pm
- Reputation: 7
- Gender:

- Contact:
Welcome to the era of "Guns and Maskies" Trading!
The previous message contains discretion. Viewer nudity is advised.
Insanity Industries Indicators Here
Insanity Industries on YouTube!
The previous message contains discretion. Viewer nudity is advised.
Insanity Industries Indicators Here
Insanity Industries on YouTube!
Please add www.kreslik.com to your ad blocker white list.
Thank you for your support.
Thank you for your support.
DoP is out of my league, I hope to have a better handle on this and some other stuff to be prepared for when MO returns at the end of the year.
To be fair, it's not just a a few confusing charts, there have been many charts posted on this topic and when the angle doubles or halves. x and y memo, the angle of the dangle, even the growth of the tree, are all going to relate to the speed of the PA and what it means for the direction of the market.
To be fair, it's not just a a few confusing charts, there have been many charts posted on this topic and when the angle doubles or halves. x and y memo, the angle of the dangle, even the growth of the tree, are all going to relate to the speed of the PA and what it means for the direction of the market.
Is price closing higher or lower than something? Simple yet powerful question. ..MO


It took me many years to learn the things that I freely show you so I don't expect you to learn it over night.
You want to know what I did for the first 4 years?
1. Open all charts in area one.
2. Take daily chart formation (H&S, NS-Channel, 1-2-3, etc) breakout long if in low areas and short if in high areas.
If you want to point at my charts and mentally shut down then be my guest.
Just know that everything has a reason:
There was more to MZ and ZL
There was more to 2x size bodies
There is more to Diamonds of Perception
If I told you everything then you would understand nothing.
-
bredin
- rank: 1000+ posts
- Posts: 1033
- Joined: Mon Feb 16, 2009 10:41 pm
- Reputation: 7
- Gender:
- Contact:
I seem to recall MO saying that price tends to double/halve in speed, and the angles give an idea of where price may be heading. I would have to reread the NLA thread to be sure 
Im getting the hang of MOMO zlines, S/D, and getting the basic idea of candle combinations and think Im beginning to see angles (DoP), but the TREE is way over my head....
G.
Im getting the hang of MOMO zlines, S/D, and getting the basic idea of candle combinations and think Im beginning to see angles (DoP), but the TREE is way over my head....
G.
Welcome to the era of "Guns and Maskies" Trading!
The previous message contains discretion. Viewer nudity is advised.
Insanity Industries Indicators Here
Insanity Industries on YouTube!
The previous message contains discretion. Viewer nudity is advised.
Insanity Industries Indicators Here
Insanity Industries on YouTube!
-
Braathen

- rank: 500+ posts

- Posts: 615
- Joined: Mon Jul 20, 2009 6:21 pm
- Reputation: 15
- Location: Infront of the PC O_o
- Gender:

Thanks for the great pics MO! Much appriciated
Just one thing MO.. price wraps around/ur 2dimensional minds amuse me.
This made me get the picture of price spiraling around a midpoint(equilibrium).
Like ur recent drawing with the 30* channels or should i call them cylinders.
Price speeds up by 2 and slows down by half. 60* burst.. then 30* travling after initial speedup... argh my mind is wandering..
prob shouldnt post this cuz its just my ranting..
but i aint got alot of people to talk to about trading so....
Last edited by Braathen on Sun Apr 18, 2010 12:55 pm, edited 1 time in total.
"Trading is the ability to see & to plan & to act; it is not crystal balls, precision entries, and ego stroking."
MO-
MO-
Please add www.kreslik.com to your ad blocker white list.
Thank you for your support.
Thank you for your support.
-
prochargedmopar

- rank: 10000+ posts

- Posts: 12048
- Joined: Sat Dec 20, 2008 6:07 am
- Reputation: 1790
- Location: Granbury, TX
- Gender:
- Contact:
MightyOne wrote:It took me many years to learn the things that I freely show you so I don't expect you to learn it over night.
You want to know what I did for the first 4 years?
1. Open all charts in area one.
2. Take daily chart formation (H&S, NS-Channel, 1-2-3, etc) breakout long if in low areas and short if in high areas.
If you want to point at my charts and mentally shut down then be my guest.
Just know that everything has a reason:
There was more to MZ and ZL
There was more to 2x size bodies
There is more to Diamonds of Perception
If I told you everything then you would understand nothing.
The concept and price movements are very simple.
Buy/Sell in the "red" zone and add, add, add until you get to the grey zone.
It may "only" take 3-5yrs before you are able to close the trade.
Do this twice(retirement plan extraordinair)
We are approaching the highest high since before 2007.
Will we break for 2000 pips and try to take out the high from 1980?
That is the question.
When the U.S. starts to raise their int rates some time next year(my guess).....that bad boy is gonna tank.
Might just be a "red" rat zone on Mthly chart????
#1BODY in direction of profit #2INCREASE lot size Obsessively
My Losses cause me Great Laughter!
Trading Bible here> therumpledone/the-ideas-that-i-trade-by-t3256/page1670
My Losses cause me Great Laughter!
Trading Bible here> therumpledone/the-ideas-that-i-trade-by-t3256/page1670
prochargedmopar wrote:MightyOne wrote:It took me many years to learn the things that I freely show you so I don't expect you to learn it over night.
You want to know what I did for the first 4 years?
1. Open all charts in area one.
2. Take daily chart formation (H&S, NS-Channel, 1-2-3, etc) breakout long if in low areas and short if in high areas.
If you want to point at my charts and mentally shut down then be my guest.
Just know that everything has a reason:
There was more to MZ and ZL
There was more to 2x size bodies
There is more to Diamonds of Perception
If I told you everything then you would understand nothing.
The concept and price movements are very simple.
Buy/Sell in the "red" zone and add, add, add until you get to the grey zone.
It may "only" take 3-5yrs before you are able to close the trade.
Do this twice(retirement plan extraordinair)
We are approaching the highest high since before 1985.
Will we break for 2000 pips and try to take out the high from 1980?
That is the question.
When the U.S. starts to raise their int rates some time next year(my guess).....that bad boy is gonna tank.
Might just be a "red" rat zone on Mthly chart????
Those 1,000+ pip moves that are running on pairs you do not actively trade are a very nice boost to your account.
It is hard to stress over a losing trade when you are up 700 pips on another pair.
The gains that you get while sleeping will also push your position sizing on your short term trades upwards.
-
prochargedmopar
- rank: 10000+ posts
- Posts: 12048
- Joined: Sat Dec 20, 2008 6:07 am
- Reputation: 1790
- Location: Granbury, TX
- Gender:
- Contact:
I would suspect M.O. is coming back in Dec to go long the cable.
#1BODY in direction of profit #2INCREASE lot size Obsessively
My Losses cause me Great Laughter!
Trading Bible here> therumpledone/the-ideas-that-i-trade-by-t3256/page1670
My Losses cause me Great Laughter!
Trading Bible here> therumpledone/the-ideas-that-i-trade-by-t3256/page1670
-
newark18

- rank: 500+ posts
- Posts: 562
- Joined: Thu Mar 11, 2010 3:32 am
- Reputation: 21
- Real name: J
- Gender:
MightyOne wrote: Just know that everything has a reason:
There was more to MZ and ZL
There was more to 2x size bodies
There is more to Diamonds of Perception
If I told you everything then you would understand nothing.
It seems that everything is inter-related somehow but we just don't know why. 2X size bodies is eerily similar to price increases x 2. The half way point of a momo candle is eerily similar to price decreases by half.
Maybe only a coincidence but seems related to me.
Failure is an opportunity to learn.
-
newark18
- rank: 500+ posts
- Posts: 562
- Joined: Thu Mar 11, 2010 3:32 am
- Reputation: 21
- Real name: J
- Gender:
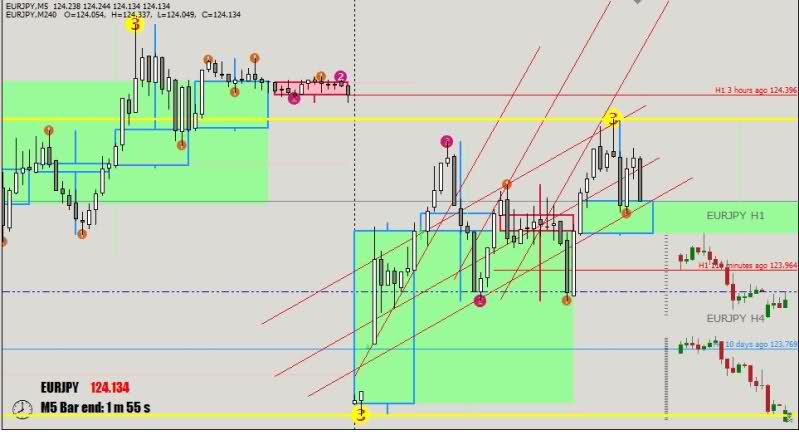
EJ seems to be running on a 30* channel as shown on the pic below. Seems like when price breaks out of the 30* channel (i.e., increases speed to 60*), the correction is much larger.
But how do you predict that its going to be a correction instead of a reversal? Combine DOP with horizontals? Possibly...
How do you predict when it will continue on the 60* path instead of reversing and staying within the 30* channel?
Look at the price now, looks like its slowing...maybe this is the reversal?
Maybe MO will be kind of enough to provide more pictures.
Failure is an opportunity to learn.
Please add www.kreslik.com to your ad blocker white list.
Thank you for your support.
Thank you for your support.