MO's MBT Micro
Moderator: moderators

Please add www.kreslik.com to your ad blocker white list.
Thank you for your support.
Thank you for your support.


Braathen wrote:Didnt know where to post this .. nla is choppy so i hope u dont mind me posting a few things MO.. if u do you know where to flame meh
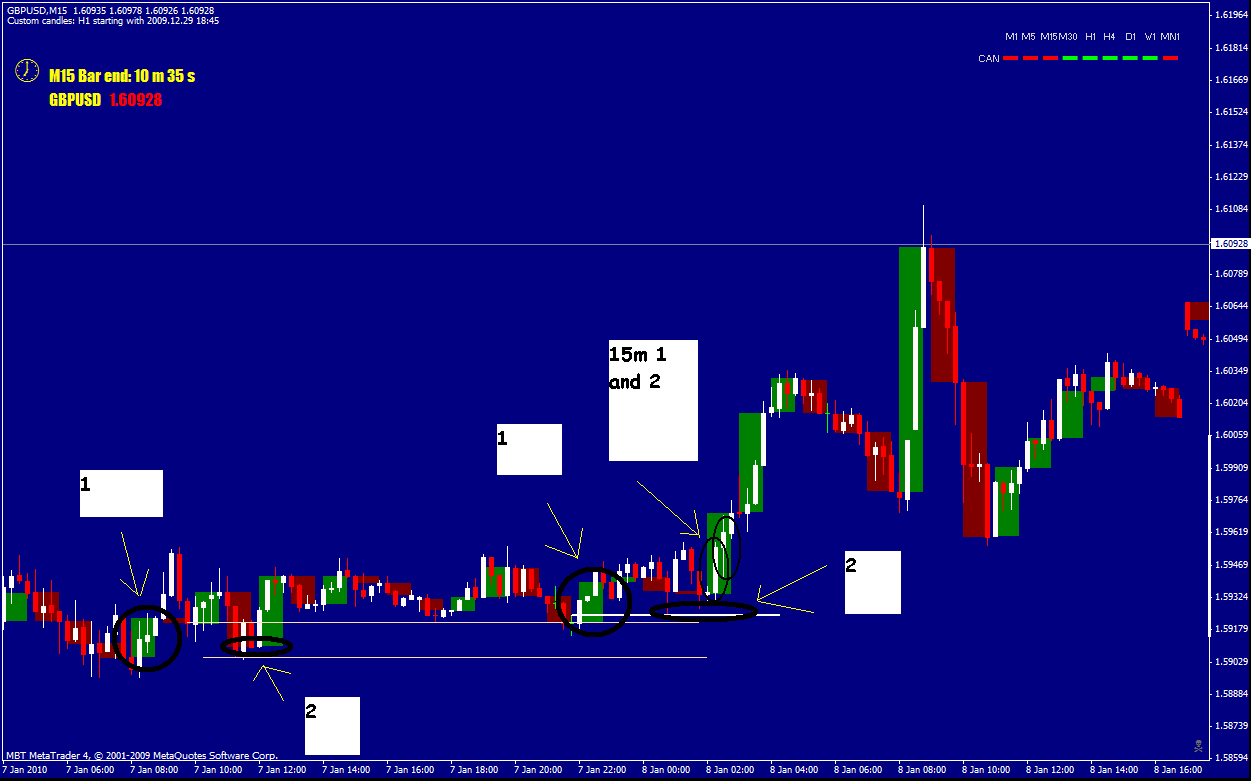
So completly back to basics for me. This is my interpretation of recent GU activity... looks like ive been overthinking this all along.. total basics i know and prob a waste of posting space but any comments would be appriciated .. Its the build up to fridays nfp news.. Hit the low area from the christmas/newyear move.. simple 15m chart with 1hour candles layover. 1 = body in the direction of profit. 2 = wick in the direction of loss.
first one was iffy imo but the second 1h 1,2 was nice and the 15m to confirm holding
Maybe someone who traded this could give there story.
The chart is moving sideways.
Where you have the first "2" marked the chart
begins to show activity when you compare to
the previous body sizes.
The chart then goes dead with extreme
quietness followed by four bodies...
bullish, bearish, bearish, bullish
that could only be considered activity after
extreme quietness.
There is another 3-bar period of extreme
quietness and the chart closes a bullish bar
that is larger than all the previous candles.
Based on this information what can you conclude?
Closed bodies tell a story that can only be read
through making comparisons.
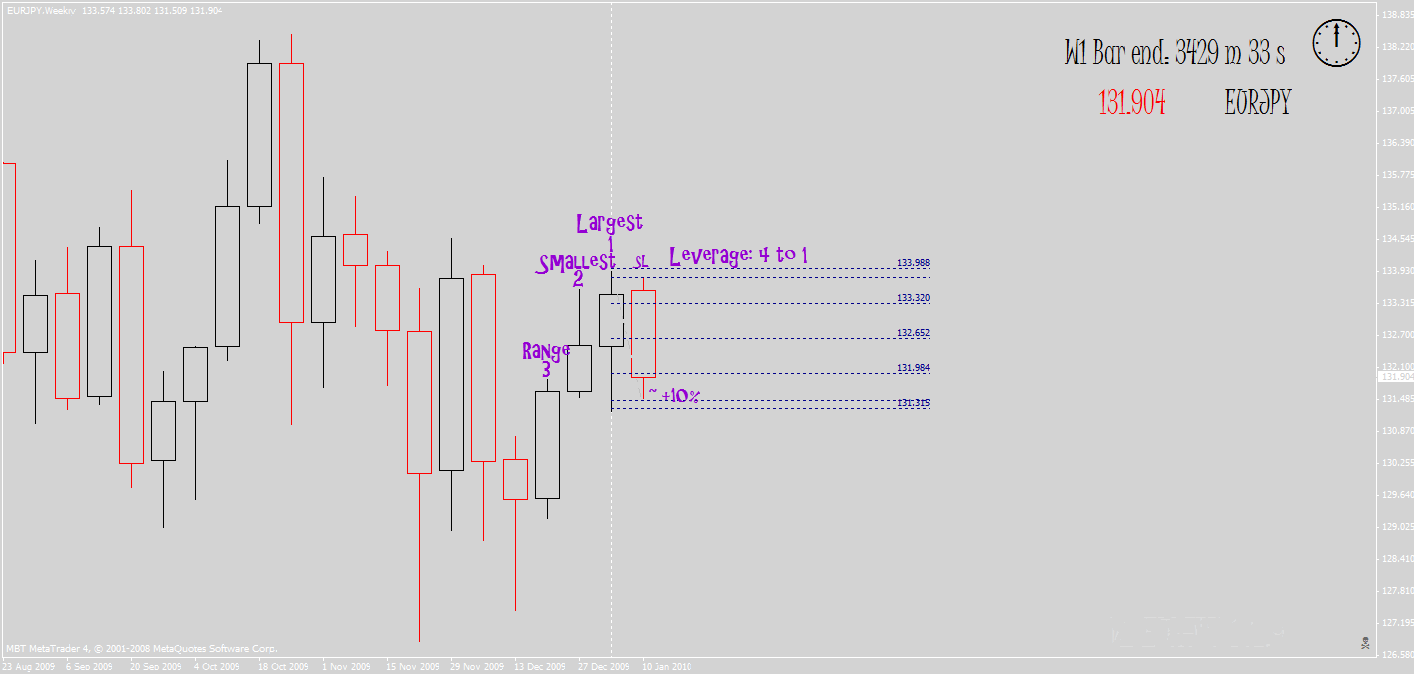
Per $5,000
RP SIZE MaxRisk
025: 08 to 1 [02%]
050: 06 to 1 [03%]
100: 04 to 1 [04%] <---SL between 50 & 100 so leverage is 4 to 1.
111: 3.6 to 1 [04%]
125: 3.2 to 1 [04%]
142: 2.8 to 1 [04%]
166: 2.4 to 1 [04%]
200: 02 to 1 [04%]
250: 1.6 to 1 [04%]
333: 1.2 to 1 [04%]
500: 0.8 to 1 [04%]
1000: 0.4 to 1 [04%]
Please add www.kreslik.com to your ad blocker white list.
Thank you for your support.
Thank you for your support.

MightyOne wrote:I am not ignoring anyone, I have been busy with family and friends.
My baby sister had her baby today btw
Feel free to post about anything and I will start answering in the near future
PS: I have been using the range of the 2nd largest of the last 3 candles as the range for division; averages have been giving me numbers that are either too large or too small.
Another thing I do is wait for the entry candle to close and then liquidate shortly after breakout (hopefully there is a BO).
What else...
I've been trading smaller position sizes on the first entry and reversing with a full position if stopped + other small adjustments based on what I see working.
I just
buy if price is going up
sell if price is going down
&
reverse instead of exiting.
Don't feel like you have to do things as I am doing them.
These adjustments were made on the weekly charts NOT small time frame charts like the 8 hour
MAYBE MaybE maYbE
1) i put up TRO2009 Breakcount UI and check the statistics of the timeframe where there is good pips with good %. With the timeframe to my appetite, i put up the pips for x average (?smaller better, but more unstable, default 24).
2) more important factor = holding period to target. high target reduce probability. long holding increase probability. long holding also increase stop probability.
3) direction : open to close each day average 100 pips. to go up 100 points, the only way for price to go there is making new high and vice versa. when i zoom in the bar, usually only ~20-30% of the bars (=time) contribute to the high/low. 100/bar division *20-30% = maybe significant pips/bar.
4) for price to move from A to B, by new H or new L, there are wicks on each bar unfortunately. the wicks are available almost all the time each bar from minute 1 to yearly chart. if i took the time scale away, what are these wicks?
5) thanks to MO
I will be most enlightened when TRO share more on the HOW.
* anyOne can be prOfitable tradING ANY line. see it?
franck wrote:MightyOne wrote:I am not ignoring anyone, I have been busy with family and friends.
My baby sister had her baby today btw
Feel free to post about anything and I will start answering in the near future
PS: I have been using the range of the 2nd largest of the last 3 candles as the range for division; averages have been giving me numbers that are either too large or too small.
Another thing I do is wait for the entry candle to close and then liquidate shortly after breakout (hopefully there is a BO).
What else...
I've been trading smaller position sizes on the first entry and reversing with a full position if stopped + other small adjustments based on what I see working.
I just
buy if price is going up
sell if price is going down
&
reverse instead of exiting.
Don't feel like you have to do things as I am doing them.
These adjustments were made on the weekly charts NOT small time frame charts like the 8 hour
MAYBE MaybE maYbE
1) i put up TRO2009 Breakcount UI and check the statistics of the timeframe where there is good pips with good %. With the timeframe to my appetite, i put up the pips for x average (?smaller better, but more unstable, default 24).
2) more important factor = holding period to target. high target reduce probability. long holding increase probability. long holding also increase stop probability.
3) direction : open to close each day average 100 pips. to go up 100 points, the only way for price to go there is making new high and vice versa. when i zoom in the bar, usually only ~20-30% of the bars (=time) contribute to the high/low. 100/bar division *20-30% = maybe significant pips/bar.
4) for price to move from A to B, by new H or new L, there are wicks on each bar unfortunately. the wicks are available almost all the time each bar from minute 1 to yearly chart. if i took the time scale away, what are these wicks?in addition, if my stop loss can't survive wick to wick, how i am going to bring forward to the next bar realistically to capture the stats above.
5) thanks to MO
I will be most enlightened when TRO share more on the HOW.
http://www.mbtrading.com/f/MBTradingFut ... yGuide.pdf
-
TheRumpledOne

- rank: 10000+ posts

- Posts: 15558
- Joined: Sun May 14, 2006 9:31 pm
- Reputation: 3035
- Location: Oregon
- Real name: Avery T. Horton, Jr.
- Gender:

- Contact:
-
aliassmith

- rank: 5000+ posts

- Posts: 5057
- Joined: Tue Jul 28, 2009 9:50 pm
- Reputation: 2847
- Gender:

MightyOne wrote:franck wrote:MightyOne wrote:I am not ignoring anyone, I have been busy with family and friends.
My baby sister had her baby today btw
Feel free to post about anything and I will start answering in the near future
PS: I have been using the range of the 2nd largest of the last 3 candles as the range for division; averages have been giving me numbers that are either too large or too small.
Another thing I do is wait for the entry candle to close and then liquidate shortly after breakout (hopefully there is a BO).
What else...
I've been trading smaller position sizes on the first entry and reversing with a full position if stopped + other small adjustments based on what I see working.
I just
buy if price is going up
sell if price is going down
&
reverse instead of exiting.
Don't feel like you have to do things as I am doing them.
These adjustments were made on the weekly charts NOT small time frame charts like the 8 hour
MAYBE MaybE maYbE
1) i put up TRO2009 Breakcount UI and check the statistics of the timeframe where there is good pips with good %. With the timeframe to my appetite, i put up the pips for x average (?smaller better, but more unstable, default 24).
2) more important factor = holding period to target. high target reduce probability. long holding increase probability. long holding also increase stop probability.
3) direction : open to close each day average 100 pips. to go up 100 points, the only way for price to go there is making new high and vice versa. when i zoom in the bar, usually only ~20-30% of the bars (=time) contribute to the high/low. 100/bar division *20-30% = maybe significant pips/bar.
4) for price to move from A to B, by new H or new L, there are wicks on each bar unfortunately. the wicks are available almost all the time each bar from minute 1 to yearly chart. if i took the time scale away, what are these wicks?
5) thanks to MO
I will be most enlightened when TRO share more on the HOW.
http://www.mbtrading.com/f/MBTradingFut ... yGuide.pdf
I think MightyOne is trying to be a comedian
BTW: Congratz Uncle MO
Trade Your Way as Long as It Makes Money!
-
pablo101

- rank: 500+ posts

- Posts: 973
- Joined: Tue Jun 30, 2009 3:10 pm
- Reputation: 43
- Real name: Pete
- Gender:
Congrats Uncle MO

MO, just to be on the same page, would this be where I marked up #2 on the chart?
And this is at #3 right?
EQ follows activity follows EQ follows activity and so on and so forth. So knowing this we can be patient, wait for EQ to end then trade?? Razz me if I'm wrong
MightyOne wrote: The chart then goes dead with extreme
quietness followed by four bodies...
bullish, bearish, bearish, bullish
that could only be considered activity after
extreme quietness.
MO, just to be on the same page, would this be where I marked up #2 on the chart?
MightyOne wrote:There is another 3-bar period of extreme
quietness and the chart closes a bullish bar
that is larger than all the previous candles.
And this is at #3 right?
MightyOne wrote:Based on this information what can you conclude?
EQ follows activity follows EQ follows activity and so on and so forth. So knowing this we can be patient, wait for EQ to end then trade?? Razz me if I'm wrong
WAS A YALE STUDENT. Now? Let's see!
Please add www.kreslik.com to your ad blocker white list.
Thank you for your support.
Thank you for your support.